- What is asset turnover ratio?
- How is asset turnover ratio calculated?
- Why is analysis of asset turnover ratio important?
- Example of asset turnover ratio
- Ratio analysis in TallyPrime
What is asset turnover ratio?
The asset turnover ratio is an efficiency ratio that measures and helps analyse a company’s ability to generate sales from its assets by comparing net sales with average total assets. To simply put it, this ratio shows how efficiently a company can use its assets to generate sales.
The total asset turnover ratio calculates net sales as a percentage of assets to show how many sales are generated from each penny of company assets.
How is asset turnover ratio calculated?
The asset turnover ratio is calculated by dividing net sales by average total assets.
Total Sales = Annual sales total
Beginning Assets = Assets at start of year
Ending Assets = Assets at end of year
Since asset turnover ratio uses the value of a company's assets in the denominator of the formula, to determine the value of a company's assets, you first need to first calculate the average value of the assets for the year. This can be done by considering the below mentioned values:
- Locate the value of the company's assets on the balance sheet as of the start of the year
- Locate the ending balance or value of the company's assets at the end of the year
- Add the beginning asset value to the ending value and divide the sum by two, which will provide an average value of the assets for the year
- Locate total sales–it could be listed as revenue–on the income statement
- Divide total sales or revenue by the average value of the assets for the year
Why is analysis of asset turnover ratio important?
A greater ratio is always more favourable because it reflects how efficiently a company utilises its assets to create revenues. Higher turnover ratios indicate that the company is making better use of its assets. Lower ratios indicate that the organisation isn't making the best use of its resources and, more than likely, has management or production issues. The asset turnover ratio is used by investors to compare companies in the same sector or group.
Large asset sales as well as considerable asset purchases in a given year can have an impact on a company's asset turnover ratio. Comparing the asset turnover ratios of a retail company and a telecoms firm would not be particularly productive because this ratio varies so much from one business to the next. Comparisons are only meaningful when they are made for different companies within the same sector.
Example of asset turnover ratio
Rohit Tech Company is a tech start-up company that manufactures a new tablet computer. Rohit is currently looking for new investors and has a meeting with an angel investor. The investor wants to know how well Rohit uses his assets to produce sales, so he asks for his financial statements.
Here is what the financial statements reported:
- Beginning Assets: Rs 50,00,000
- Ending Assets: Rs 10,00,000
- Net Sales: Rs 25,00,000
The total asset turnover ratio, 0.41 is calculated like this: 25,00,000/(50,00,000+10,00,000)
Ratio analysis in TallyPrime
Apart from asset turnover ratio there are several other ratios that help a business manage its operations in the best way possible. They are: working capital ratio and current ratio.
The working capital ratio gives quick insights about the health of the business in terms of ratio. The working capital ratio is derived by dividing the current assets by current liabilities.
Current ratio refers to a technique that measures the capability of a business to meet its short-term obligations that are due within a year. The current ratio considers the weight of the total current assets versus the total current liabilities.
Ratio analysis in TallyPrime gives you a whole picture of where your company’s efficiency in terms of using your assets to generate maximum sales. The ratio analysis report is divided into two parts, Principal Groups and Principal Ratios. The Principal Groups are the key figures that give perspective to the ratios. Principal Ratios relate two pieces of financial data to obtain a comparison that is meaningful.
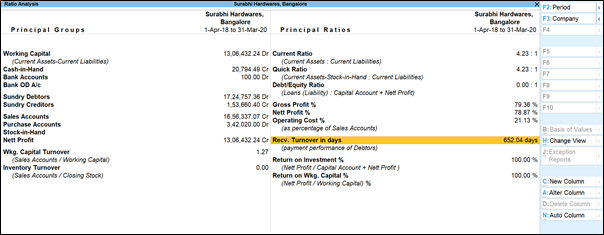
You can view this report in browser . You can drill down to the last report and find out the key areas which are disrupting your company’s cashflow and take appropriate decisions to improve its turnover.