- What is comparative balance sheet?
- Format of comparative balance sheet
- Examples of comparative balance sheet?
- Comparative balance sheet in modern day’s business
A comparative analysis is one of the widely used tools to analyze financial statements. It is an act of comparing the report for 2 or more financial years or any given period. A comparative balance sheet is one of the most sought financial statement by the business. The biggest advantage of comparing financial statements over time is discovering trends, analyzing the findings and taking suitable decisions.
To define comparative financial statements, it’s a financial statement which represents the financial position over different periods of time. The financial position is represented in a comparative form to give an idea of financial position at two or more periods.
Generally, two financial statements are prepared in comparative form for financial analysis purpose.

What is comparative balance sheet?
A comparative balance sheet is a statement that shows the financial position of an organization over different periods for which comparison is made or required. The financial position is compared with 2 or more periods to depict the trend, direction of change, analyze and take suitable actions.
Given the usefulness of the comparative balance sheet, most of the business who have different business vertical, prepare a comparative balance sheet in comparison with other business vertical.
In preparing a comparative balance sheet, the items are placed in rows, and years and amounts are shown in the columns.
Format of comparative balance sheet
|
Comparative balance sheet |
||||
|
|
Current Year |
Previous Year |
||
|
Liabilities |
|
|
|
|
|
Capital Account |
XXXX |
XXXX |
||
|
Loans (Liability) |
XXXX |
XXXX |
||
|
Current Liabilities |
XXXX |
XXXX |
||
|
Duties & Taxes |
XXXX |
|
XXXX |
|
|
Sundry Creditors |
XXXX |
|
XXXX |
|
|
Profit & Loss A/c |
XXXX |
XXXX |
||
|
Total |
|
XXXX |
|
XXXX |
|
Assets |
|
|
|
|
|
Fixed Assets |
XXXX |
XXXX |
||
|
Plant and Machinery |
XXXX |
|
XXXX |
|
|
Current Assets |
XXXX |
XXXX |
||
|
Closing Stock |
XXXX |
XXXX |
|
|
|
Sundry Debtors |
XXXX |
XXXX |
|
|
|
Cash-in-Hand |
XXXX |
XXXX |
|
|
|
Bank Accounts |
XXXX |
XXXX |
|
|
|
Input CGST |
XXXX |
XXXX |
|
|
|
Input SGST |
XXXX |
XXXX |
|
|
|
Total |
|
XXXX |
|
XXXX |
As shown in the above format, all the balance sheet items are listed in rows and years and amount are shown in the column. This way it makes it easier for comparing a balance sheet items of the current year with the previous year or any other period to which it is compared.
Be it a comparative balance sheet or Profit & Loss A/c, the comparative format remains the same and it portrays the following information:
-
- Absolute figures of the current year
- Absolute figures of the previous year or any other period.
- You can customize it to add a percentage for each item in the comparative balance sheet.
Example of comparative balance sheet
A comparative balance sheet of Guru Electronics for Financial Year 2019-20 and 2018-19
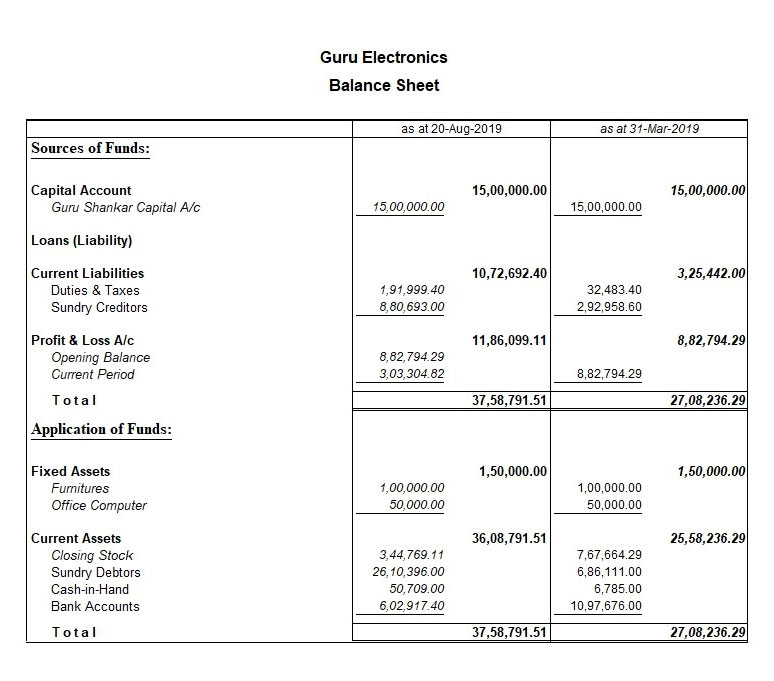
Comparative Balance Sheet Generate using Tally.ERP 9
How do businesses prepare comparative balance sheet in modern day’s business?
The value and insights that comparative balance brings to the table is of immense importance to the business owners and other decision-makers. You can quickly get to know the things which are doing good and the ones that need your attention.
Given the usefulness of the comparative balance sheet and other financial statements, most business today have automated the process of preparing a comparative balance sheet using accounting software. Using accounting software or ERP system makes it possible for you to generate comparative statements on-time for confident decision making.
In Tally.ERP 9, drawing the comparative analysis is so simple that the comparative balance sheet is ready at a blink of an eye. You will great flexibility to choose the period (Weekly, monthly, half-yearly etc.) for which you want to compare instead of the comparative report only for a financial year.
You can also compare the balance sheet and other reports across other company. This along with serval tools designed to aid analysis makes it a preferred accounting software for business like you.
Take a look at some of the comparative balance sheet generated using Tally.ERP 9.
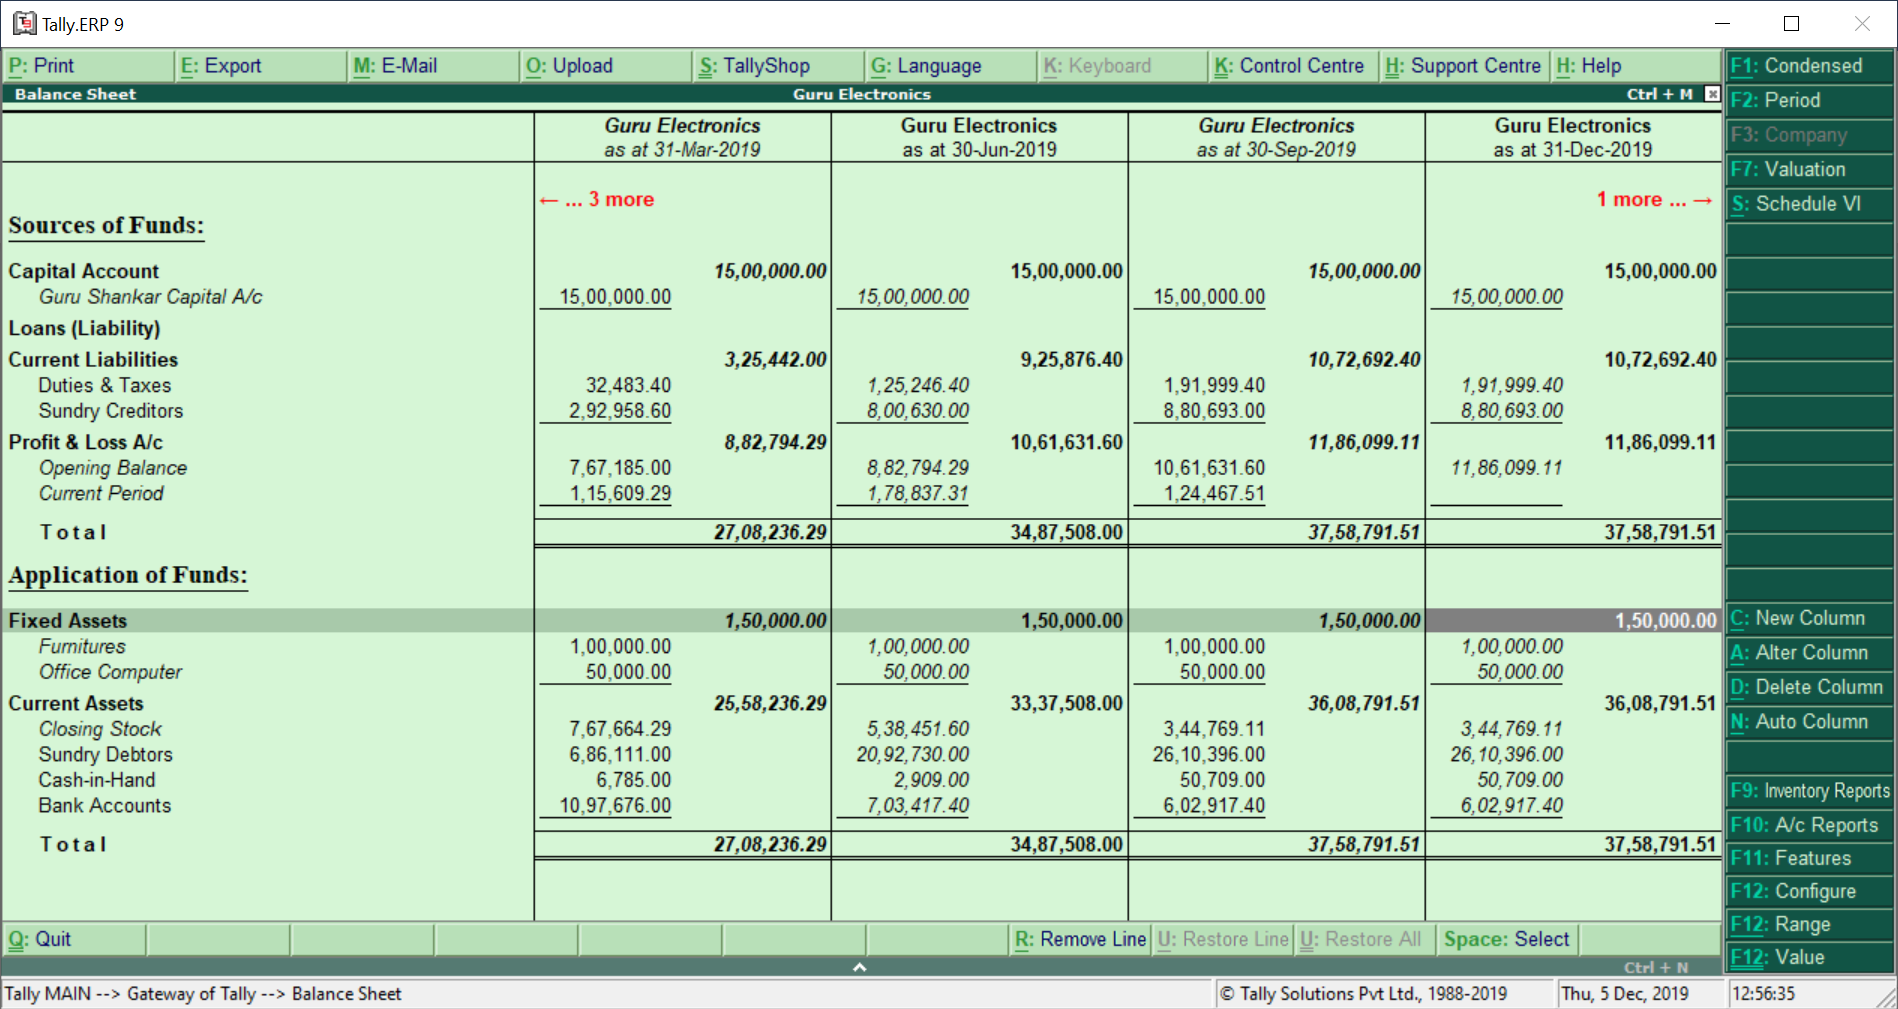
Quarterly Comparative Balance Sheet Generated using Tally.ERP 9.
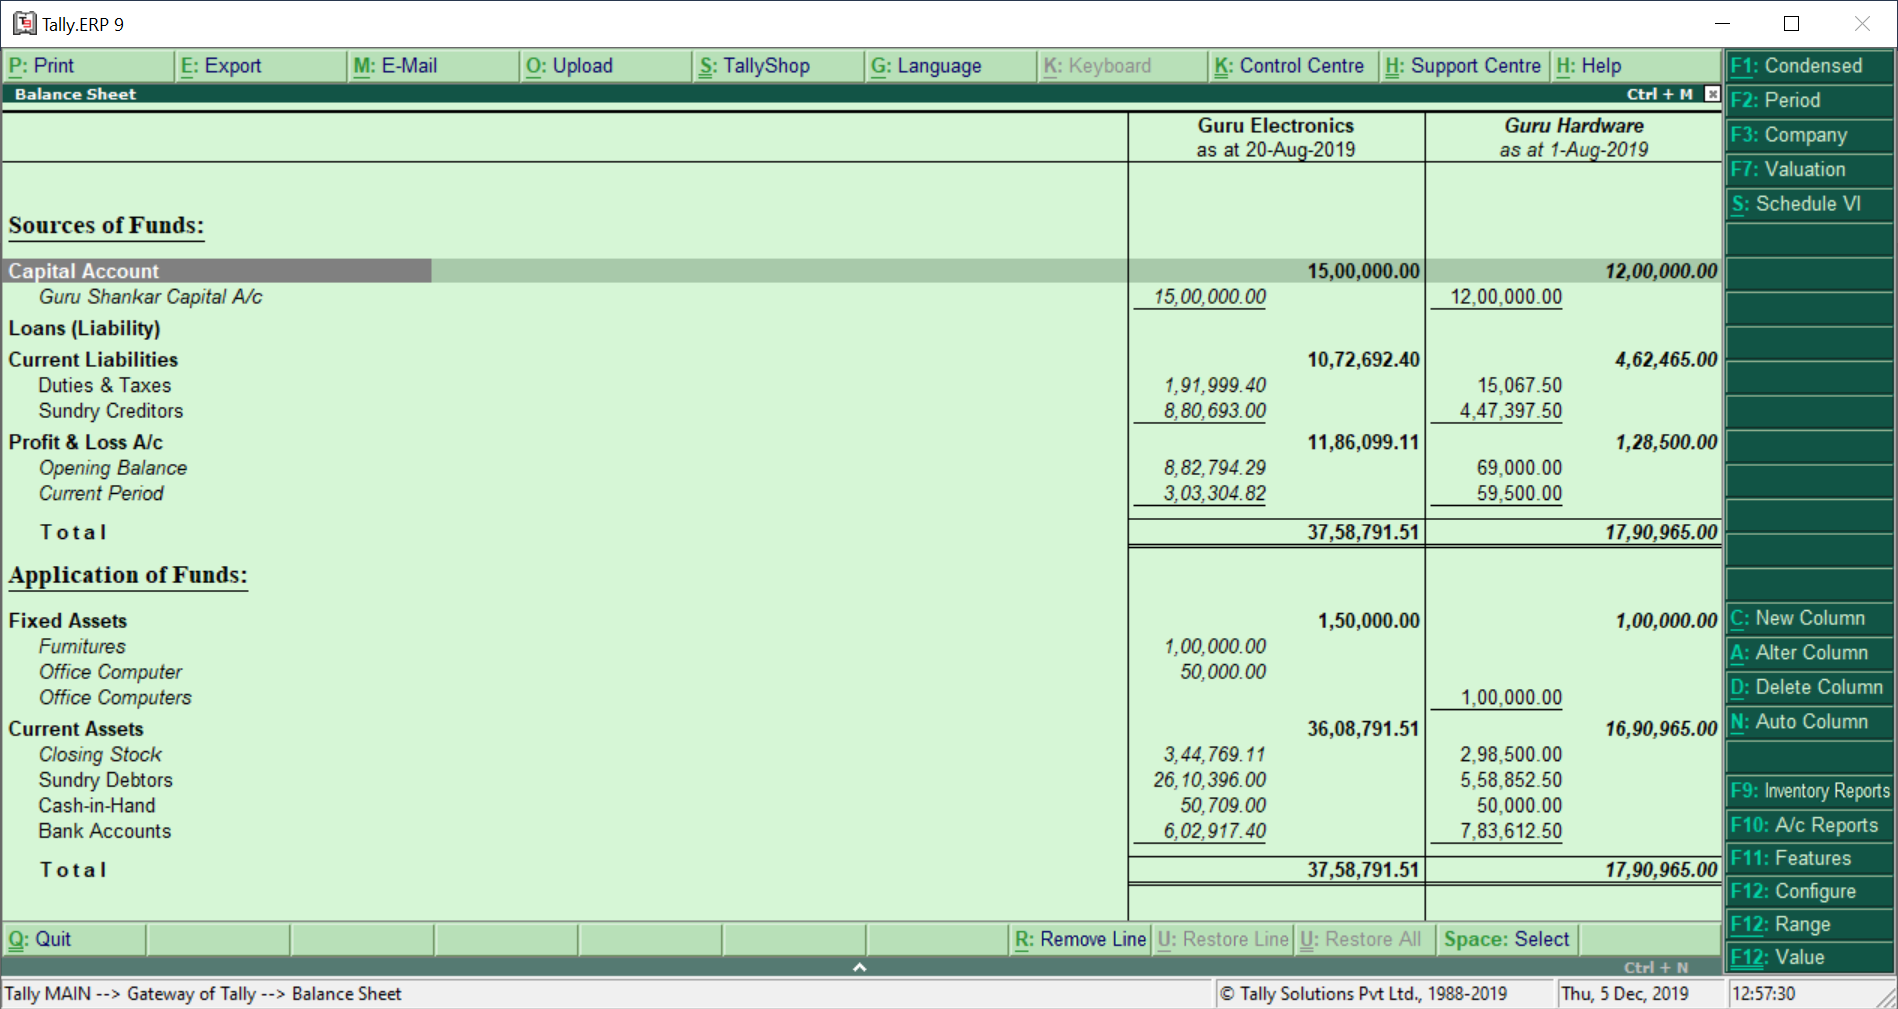
Cross Company Comparative Balance Sheet Generated using Tally.ERP
Sounds Interesting? Take a look at product offerings and try yourself.


