- Definition of Working Capital Management
- Working Capital Calculation
- Example of Working Capital
- Types of Working Capital Management Ratios
- How businesses track and manage working capital?
To begin with, working capital is simply the difference between current assets and current liabilities. The difference indicates the availability of money to run day-to-day business operations and meet short-term obligations. Now, let’s understand working capital management.
Definition of working capital management
Working capital management can be defined as a business strategy to manage working capital. In other words, working capital management is nothing but all that takes to maintain sufficient cash flow to meet various business obligations.
Working capital management involves planning, monitoring, and efficient usage of working components to have a positive impact on the cash flow.
Working capital calculation
Before we understand how working capital is calculated, let’s understand the components of working capital. The key components of working capital are current assets and current liabilities. Current assets are those that can be converted into cash in the short-term, usually, 1 year and current liabilities include all short-term debts.
Once you have determined the total value of current assets and current liabilities, you can apply the below formula to calculate working capital
Working Capital = Current Asset -Current Liabilities
Read Working Capital – Definition, Formula and How to Calculate to know more about working capital and calculation.
Example of working capital
Let’s understand the working capital calculation with an example
Below is the balance sheet of Max Electronics for the financial year ‘19-‘20. Using the details given in the balance sheet, let’s calculate the working capital of Max Electronics.
|
Max Electronics |
|||||
|
Balance Sheet for 1-Apr-19 to 31-3-20 |
|||||
|
Liabilities |
Amount |
Assets |
Amount |
||
|
Capital Account |
20,00,000 |
Fixed Assets |
7,50,000 |
||
|
Capital |
20,00,000 |
|
Office Computers |
1,50,000 |
|
|
Loans (Liability) |
1,50,000 |
Office Furnitures |
6,00,000 |
|
|
|
Long-Term Borrowings |
1,50,000 |
|
Current Assets |
72,26,215 |
|
|
Current Liabilities |
37,00,346 |
Closing Stock |
12,64,500 |
|
|
|
Duties & Taxes |
6,86,778 |
|
Sundry Debtors |
44,74,090 |
|
|
Sundry Creditors |
30,13,568 |
|
Cash-in-Hand |
72,810 |
|
|
Profit & Loss A/c |
21,25,869 |
Bank Accounts |
14,14,815 |
|
|
|
Opening Balance |
14,14,083 |
|
|
||
|
Current Period |
7,11,786 |
|
|
||
|
Total |
|
79,76,215 |
Total |
|
79,76,215 |
Now, lets us apply the formula to determine the working capital of Max Electronics
Working Capital = Current Asset -Current Liabilities
72,26,215 – 3700346 = 35,25,869
The working capital of Max Electronics is 35,25,869.
current ratio, also known as working capital ratio, measures the availability of enough resources to meet its short-term obligations. In short, it tells you the readily available cash to meet day-to-day obligations. The formula to calculate the current ratio is given below:
Working Capital Ratio = Current Assets/Current Liabilities
Let’s consider the above example of Max Electronics to calculate current ratio.
7226215 / 3700346 = 1.95:1
The working capital ratio of Max Electronics is 1.95:1. This indicates that Max Electronics has enough cash to pay its short-term debts. A working capital ratio below 1 indicates negative working capital which means that the business is facing some sort of financial difficulties in paying their debts.
- Inventory Turnover Ratio
Inventory holds up a huge working capital and this is why businesses need to measure how well the inventories are put into use. Inventory turnover ratio measures how many times a company has sold and replaced inventory in a given period. Below is the formula to measure inventory turnover ratio.
Inventory turnover ratio = Sales/closing stock
Higher inventory ratio indicates the inventories are sold faster and a low turnover ratio indicates poor sales and overstocking.
- Collection Ratio
Collection ratio indicates the receivable turnover in days. It tells you the average time taken by your customer to pay you. This ratio helps you identify the customers who have a poor payment record. Below is the formula to calculate collection ratio.
Collection Ratio = Accounts Receivable/Total sales x 365 days
How businesses track and manage working capital?
A positive working capital ratio indicates the business is well-positioned to pay its short-term debts. While a negative working capital reflects the financial difficulties to settle short-term debts. Here is why working capital management plays a key role to ensure sufficient availability of resources to meet its obligations.
Given the importance and frequent need to track, monitor and measure working capital, most of the businesses have automated the process using business management software. Through auto-generated reports, business management software helps you to be on top of the working capital needs of the business.
Using TallyPrime’s ratio analysis report, you can instantly know the financial ratios including the working capital ratios. Ratio analysis report helps you compare different sets of financial data, giving you an understanding of the financial position of a business.
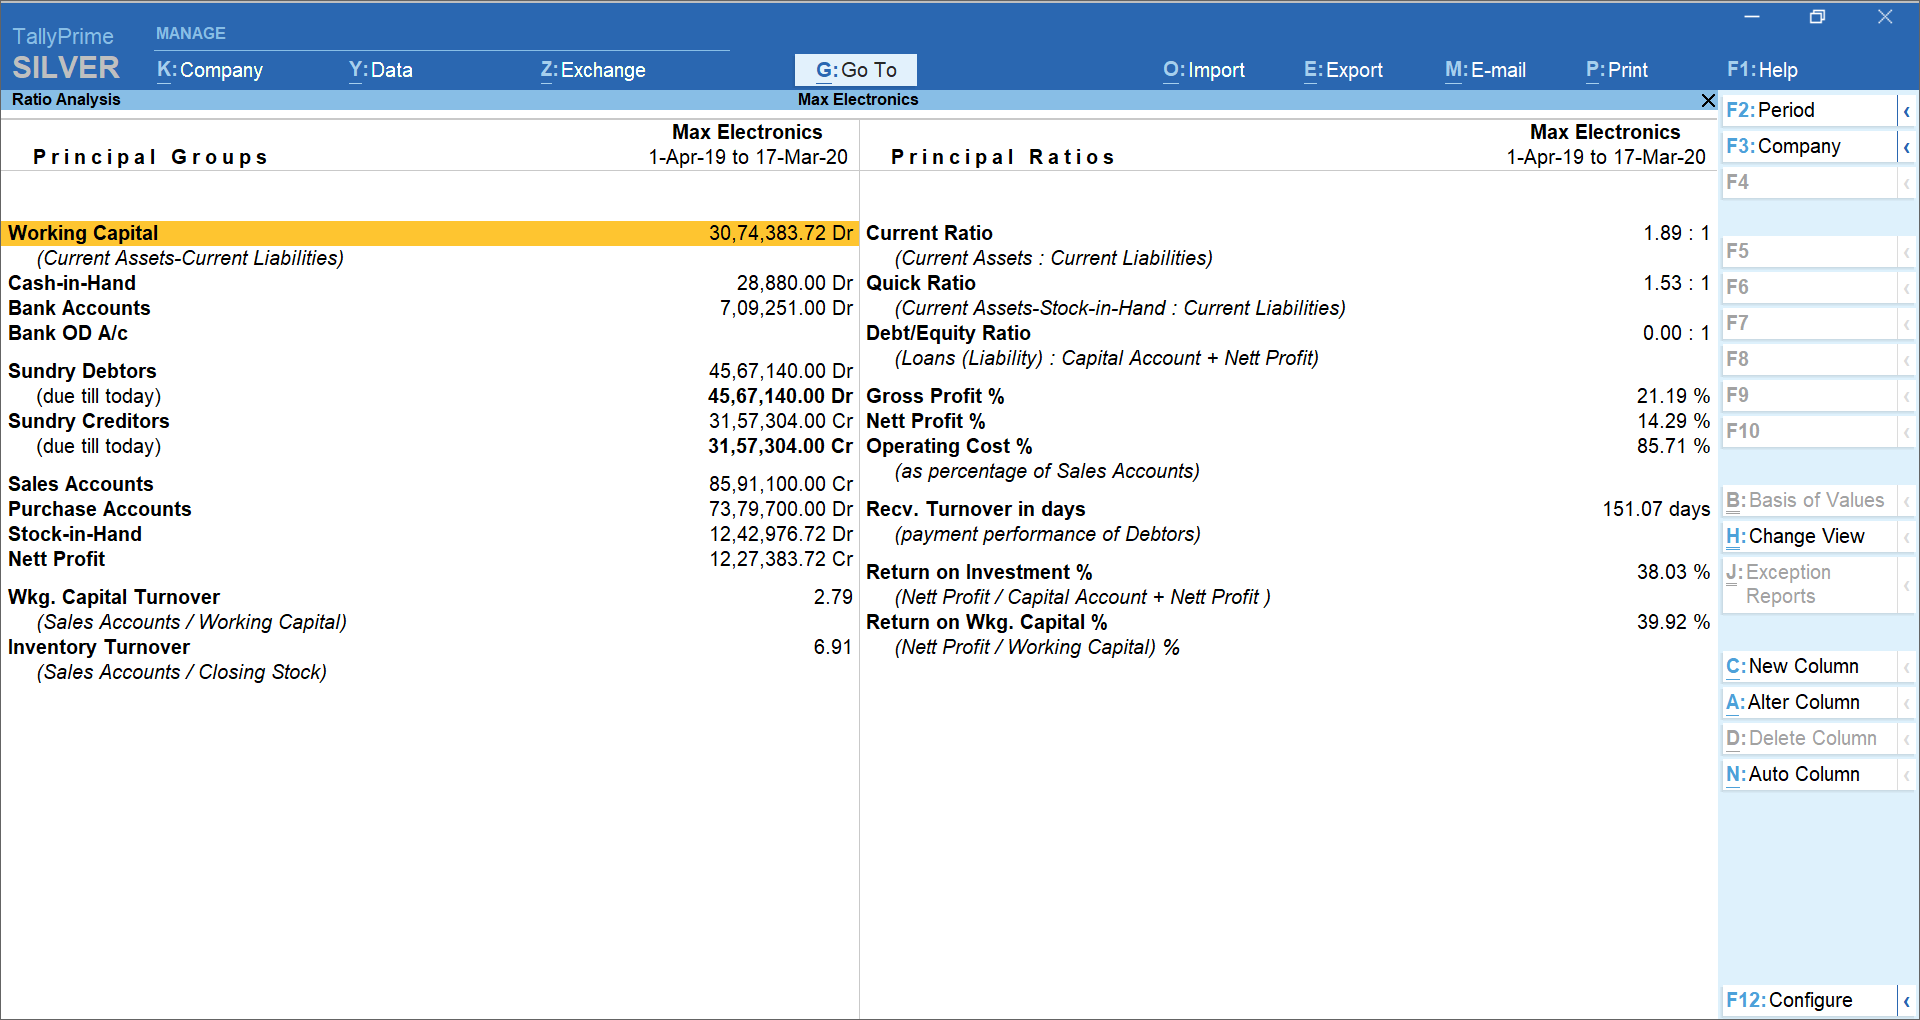
Ratio analysis report generated in TallyPrime
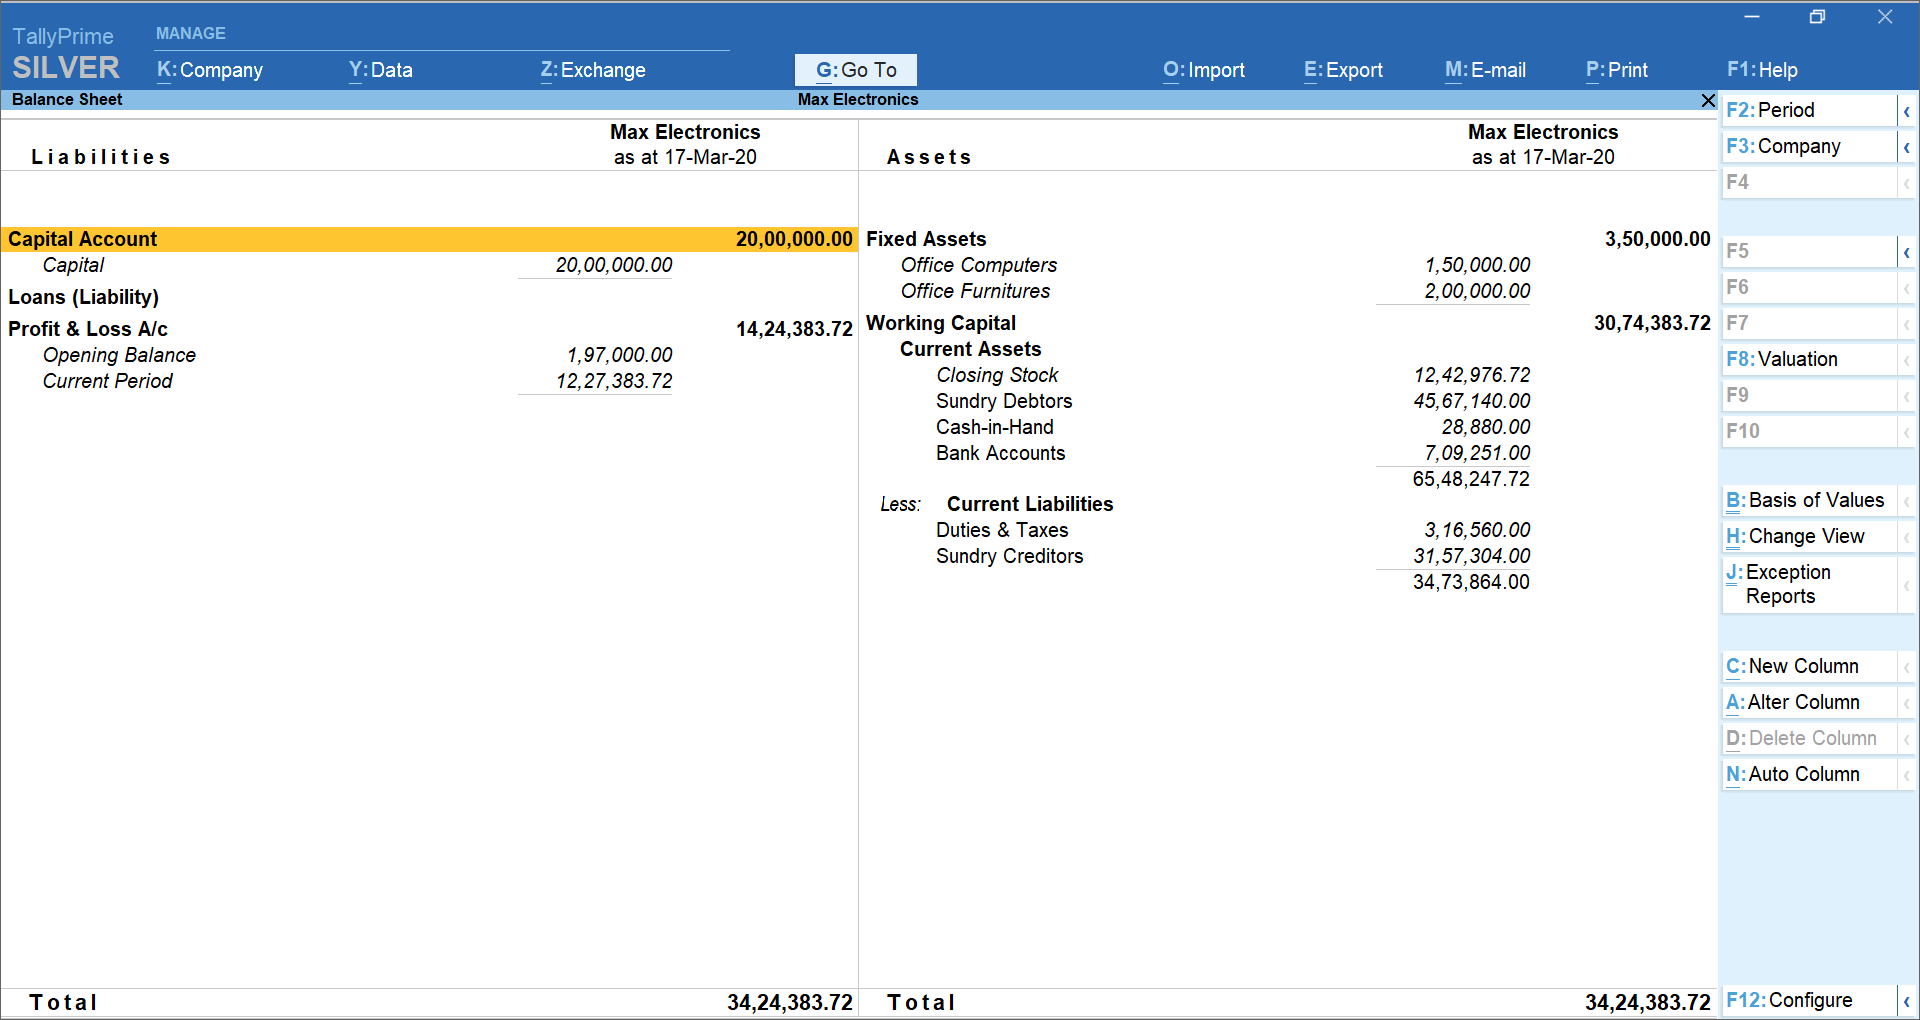
Balance sheet representing working capital in TallyPrime