Why am I looking at profitability, not just profit?
If you want to know if a sale was actually worth the effort, stop looking at your P&L and go to your Sales Register. Press F7. In my two decades working with manufacturers and automobile dealers, I have seen far too many owners blinded by a "healthy" Profit figure while their cash flow is suffocating.
Profit is merely an absolute value (Total Income minus Total Expenses). Profitability, however, is the relative measure of your business efficiency, usually expressed as a percentage. It tells you how hard your money worked to earn that profit. You do not need complex analytics or a data science degree; you simply need to master the native toggles already available at your fingertips.
Can I see profitability for every single invoice?
Most Tally users treat the Sales Register as a simple list of transactions. This is a mistake. The Sales Register is your primary tool for real-time margin defense.
Navigation path: Gateway of Tally > Display More Reports > Account Books > Sales Register
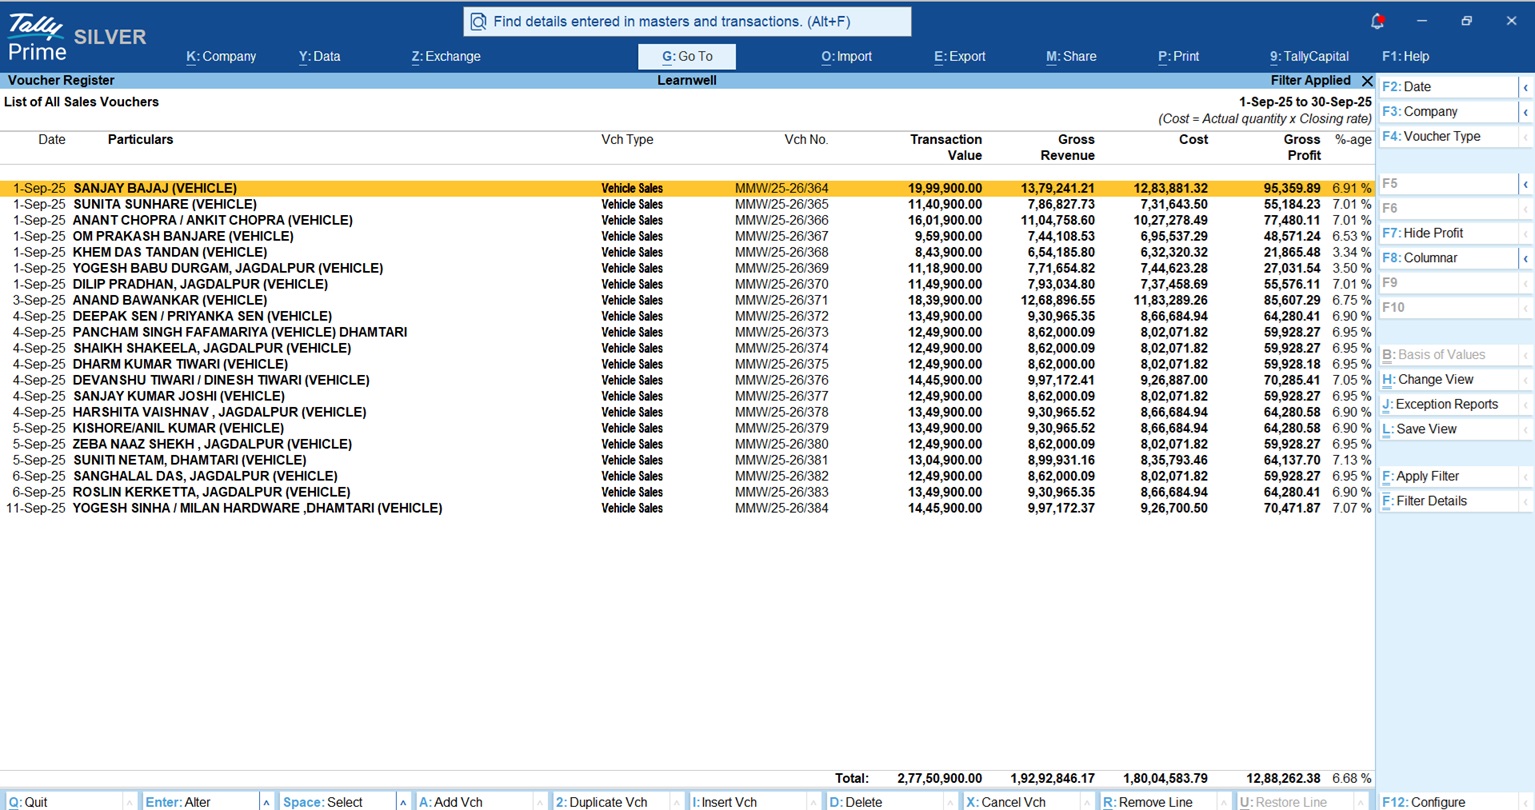
Drill down into any month and press F7 (Show Profit). TallyPrime will expand the report into four critical columns:
|
Column |
Description |
|
Transaction Value |
The total invoice amount (includes GST/Taxes). |
|
Gross Revenue |
The actual sale value (excludes GST/Taxes). |
|
Cost |
The book cost of the product based on your valuation method. |
|
Gross Profit |
The absolute margin earned on that specific sale. |
Expert advice: While in this report, press F12 (Configuration) and enable "Show Gross Profit Estimates." This ensures you are seeing real-time accuracy based on your current stock valuation. Remember: The profit shown here is Gross Profit. Do not confuse this with Net Profit, which only appears after indirect overheads are factored in at the P&L level.
Which items are actually making me money? (Item-wise analysis)
High-volume items often hide low-margin realities. To find your true "stars," you must analyze the Stock Summary.
As a Senior Consultant, I must distinguish between two critical Tally features:
- Costing methods: These determine how you value your inventory (e.g., Average Cost or FIFO). For example, electronics dealers should use FIFO to ensure older, high-cost stock is cleared first, while commodity traders often stick to Average Cost.
- Market valuation methods: These help you auto-fill selling prices (e.g., Last Sales Price or Standard Price). This is vital for maintaining profitable rates regardless of purchase price fluctuations.
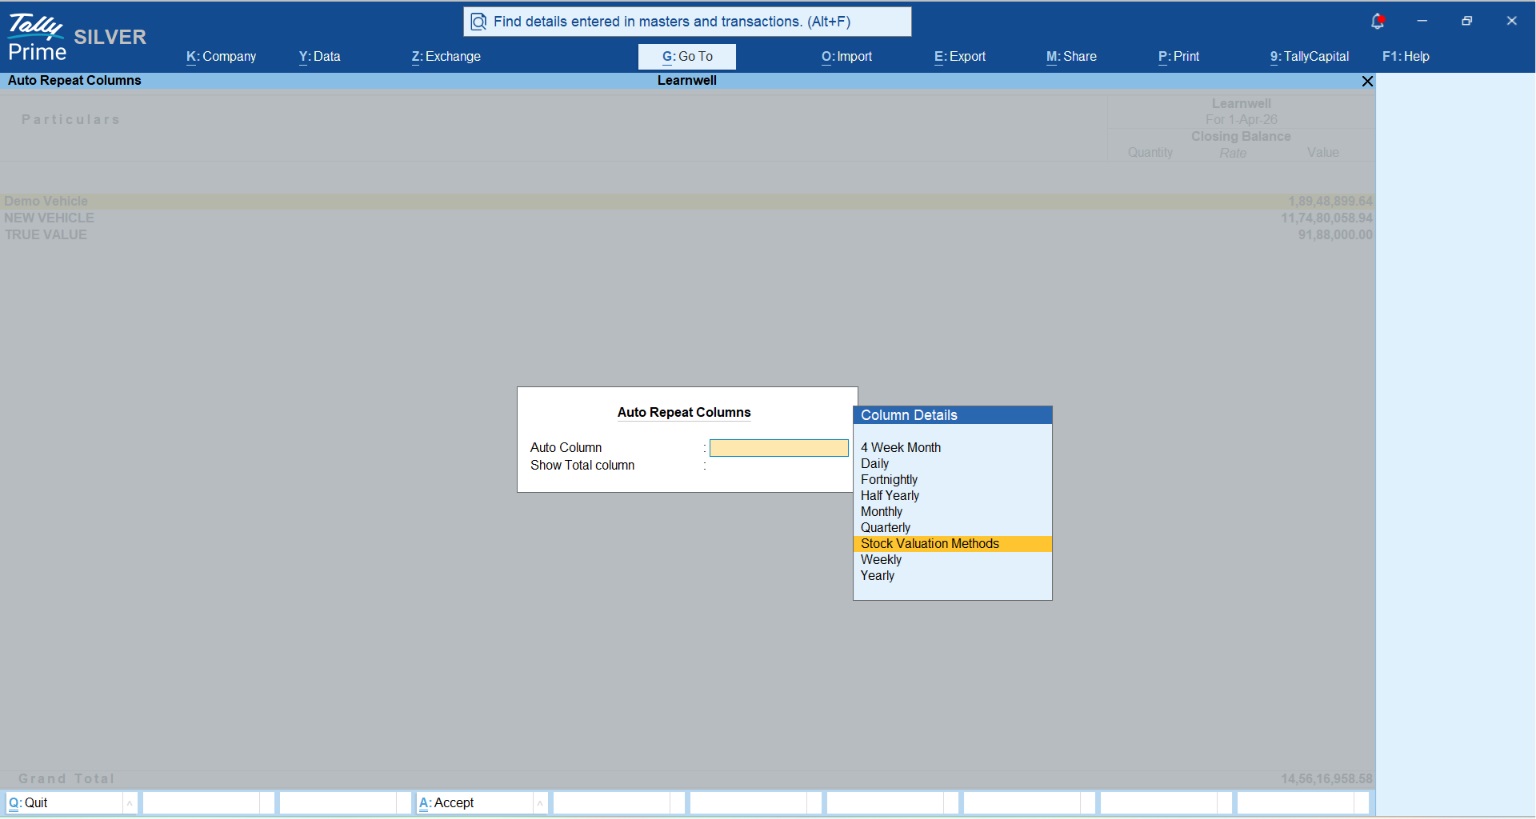
Actionable command: The Strategic Comparison To see how your choice of valuation affects your bottom line:
- Go to Stock Summary.
- Press Alt+N (Auto Column).
- Select Stock Valuation Methods.
Tally will generate a side-by-side report. Use this to decide if your current method (default is Average Cost) is accurately reflecting your sector’s reality.
Who are my most profitable customers? (Party-wise analysis)
The biggest trap in business is the illusion of top-line revenue. We naturally gravitate toward the clients who give us the most volume, often rolling out the red carpet for them. But raw sales figures lie.
A customer who buys ₹10 Lakhs a month but demands a 15% discount, extended credit terms, and constant administrative handholding is actively bleeding your margins. In contrast, a ₹2 Lakh customer who buys at full margin, pays on time, and requires zero follow-up is an asset. To build a sustainable business, you must shift your focus from gross turnover to net profitability per client.
The navigation path: Finding the truth in TallyPrime
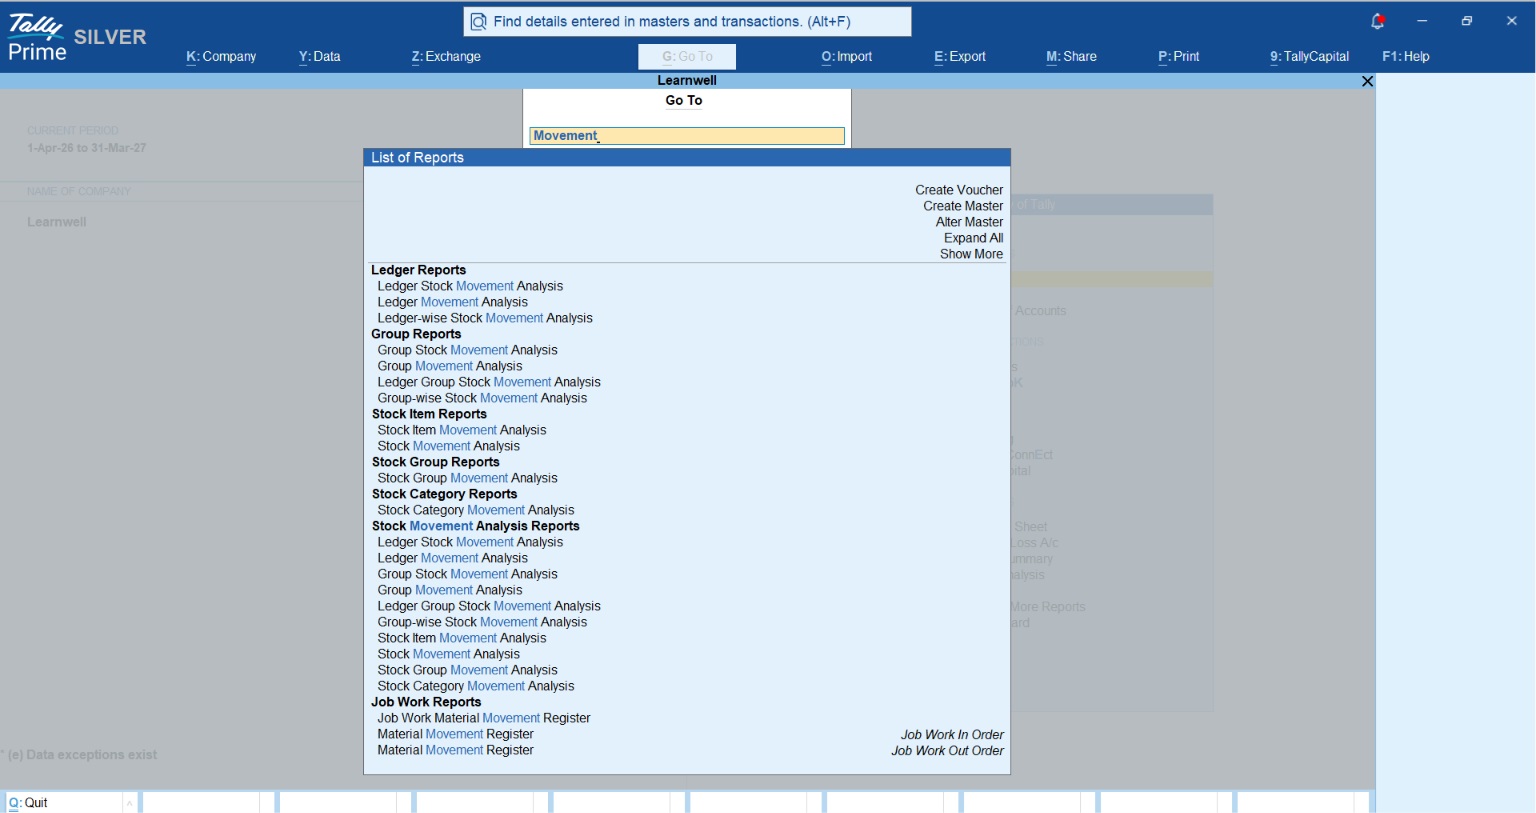
Navigation: Press Alt+G (Go To) > Type "Movement" > Select Ledger Movement Analysis > Select your specific Party/Customer.
Once you open the Ledger Movement Analysis for a specific buyer, you step into the role of a financial detective. Look beyond the total invoice value and examine details. Also can analyse different type movement analysis reports from the list.
- Check are they only buying your "loss leaders" (low-margin, high-volume goods) on heavy discounts, or are they purchasing high-margin premium items?
- After applying scheme discounts, trade discounts, and spot reductions, what is the actual effective rate per item?
Practical insight: Leveraging cost centres for client efficiency
Standard accounting tracks expenses by natural classification (e.g., "Traveling Expenses" or "Freight Outward"). While this is fine for compliance, it is useless for strategic decision-making.
I strongly advocate using Cost Centres not just for internal departments, but as dedicated tracking mechanisms for high-value projects or specific client accounts. This is where you transform data entry into high-level advisory.
Read What is CostCentre in TallyPrime
Real-world example: The manufacturer’s dilemma
I recently consulted for an auto-parts manufacturer facing a classic business paradox: record-breaking sales, yet a rapidly shrinking bank balance. On paper, their gear assemblies were flying off the shelves. The reality? They were bleeding cash.
The fix was hidden in plain sight within TallyPrime. By enabling Cost Tracking (F11 Features), we linked every single expense, from raw materials to manufacturing overheads directly to the final sale.
When we generated the Item Cost Track Breakup report, the hidden culprit was instantly exposed: "landed costs" (inward freight and duties) had quietly spiked. Because the client was treating these as general indirect expenses rather than tracking them against specific items in real-time, their celebrated "top-seller" was actually being sold at a near-loss.
Armed with this data, we immediately recalibrated their Standard Selling Rates in the Item Master. The bleeding stopped, and their healthy net margins were fully restored within 30 days.
![]()
Expert framework: The "Weekly Profitability Check"
I advise every business owner and professional I work with to implement this 3-step audit every Saturday morning. No excuses. It takes just 15 minutes but protects your margins for the entire month.
- Check Sales Register (F7) for Red Flags: Open your Sales Register, press F7 (Show Profit), and actively scan for minus profit entries. Treat these as active leaks in your financial boat. Don't just glance over them, drill down immediately to find out whether it was a pricing error, excessive discounting, or an inward cost spike.
- Audit Stock Summary for 'Dead Weight': Inventory is simply cash sitting on a shelf. Use the Stock Summary to identify slow-moving stock. Holding costs are silent profit-killers. If a product hasn't moved in 60 days, it is tying up your working capital and ultimately costing you far more than its initial purchase price.
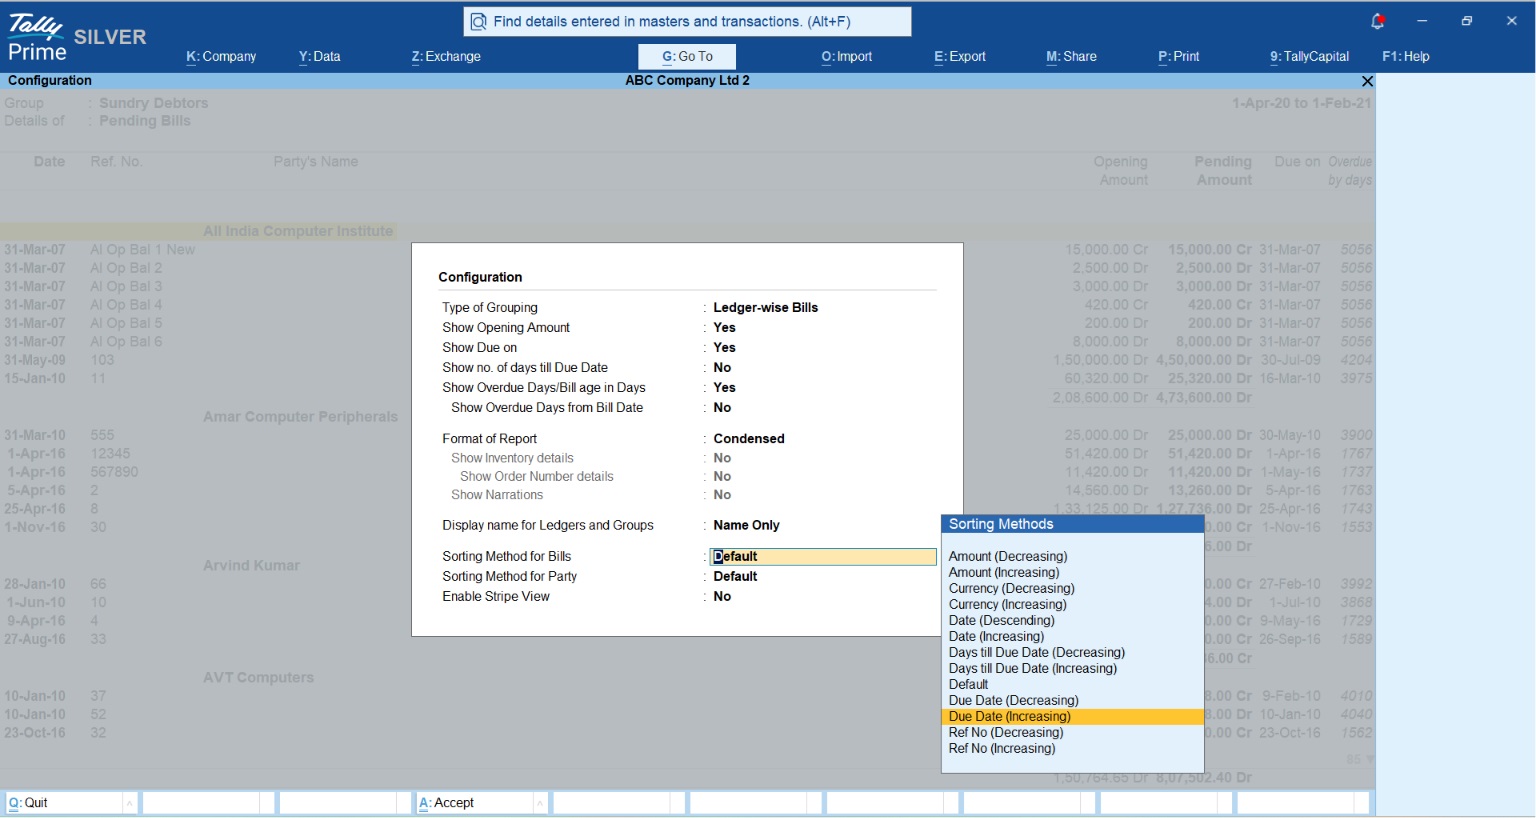
- Analyze Outstandings (TallyPrime 5.0+ Tip): Navigate to Ledger Group Outstandings > Ledger Wise Bills, press F12 (Configure), and set the Sorting Method to Due Date (Increasing). Stop obsessing over who owes you the highest amount, and start focusing on whose money is the most overdue. Always remember: Paper profit is a fantasy; cash in the bank is the only reality.
Conclusion: Your next steps for better margins
You don't need expensive BI software; you just need to stop ignoring the keys you already pay for. Profitability is a choice made through visibility.
Your checklist for tomorrow:
- Enable "Cost Tracking" in F11 to capture true landed costs.
- Toggle F7 in your Sales Register to audit last month's margins.
- Set "Standard Buying and Selling Rates" in your Stock Item masters to lock in your profit floors.
"Profit is what you earned; profitability is how hard your money worked to earn it."