- Introduction
- 5 ratios to consider to understand your company’s financial status
- How do financial ratios assess your business’ future?
Introduction
Ratios always create a sense of confusion, apprehension and nervousness. However, while these ratios might be tricky to arrive at, they give you a clear picture of the respective reports for boosting the efficiency of your business.
One such crucial ratio is financial ratios that are created using numerical values extracted from financial statements through which business owners can gain meaningful information about their company. The numbers that give a view of the financial position of the company include figures from balance sheet, income statement, and cash flow statement. These numbers are then used to perform quantitative analysis and assess a company’s liquidity, leverage, growth, margins, profitability, rates of return, valuation, and more.
5 ratios to consider to understand your company’s financial status
Financial ratios are categorised into 5 basic groups. Let’s have a look at each one of them and what they reveal!
Working capital ratio
For a company to assess its future, it is crucial that the business owner keeps a close eye on the working capital. Working capital is nothing but a company’s ability to pay off its current liabilities with the help of its current assets. It is simply calculated by subtracting current assets from current liabilities. If the number derived is positive, that means that the company’s financial condition is stable, and it is safe for the investors to put in some money in that company.
Another important aspect to assess the financial health of a company is to understand its liquidity, and how seamlessly can the company turn its assets into cash to pay off short term debts. The working capital ratio is calculated by dividing current assets by current liabilities. To understand this better, let’s say if A Company has current assets of INR 4 crore, and current liabilities of INR 2 crore, which gives a 2:1 ratio, that’s pretty decent. However, if two similar companies each had 2:1 ratio, but one had more cash among its current assets, that firm would be better able to pay off its debts quicker than the other, as it has a higher liquidity ratio.
Quick ratio
This is also referred to as acid test ratio, in which the inventories are subtracted from current assets, before dividing it into liabilities. It basically helps you to assess the liquidity position and measure your company’s ability to meet its short-term obligations with its most liquid assets. This ratio is considered to be a more conservative method than the current ratio, as it includes all current assets as coverage for current liabilities. For example: A company with a quick ratio of less than 1 may unable to fully pay off its current liabilities in a short term. On the other hand, a company having a quick ratio higher than 1 can instantly get rid of its current liabilities. For instance, a quick ratio of 1.5 indicates that a company has INR 1.50 crores of liquid assets available to cover each INR 1 of its current liabilities.
Earnings per Share (EPS)
While purchasing a stock of a company, you are signing up for all the risks and future earnings of the company. No matter how the company’s shares are performing, your income would be directly impacted. Earnings per share is basically the net income that you earn on each share of a company’s common stock. Earnings per share (EPS) is a company's net profit divided by the number of common shares it has outstanding. EPS indicates how much money a company makes for each share of its stock, and is a widely used metric to estimate corporate value.
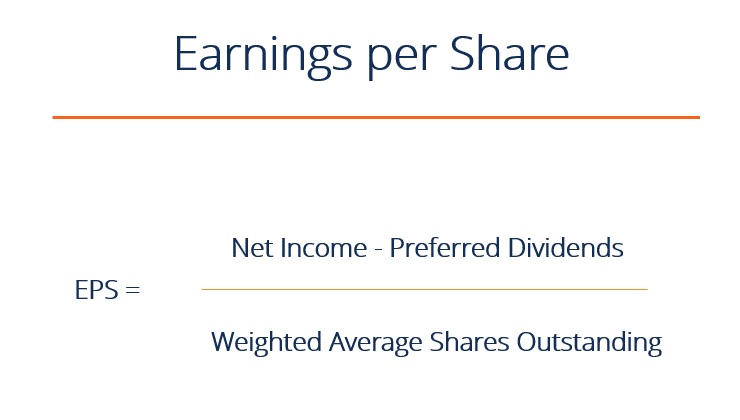
If a company has zero or negative earnings (i.e. a loss) then earnings per share will also be zero or negative.
Price-Earnings (P/E) Ratio
The price-to-earnings ratio aka P/E ratio helps in reflecting investors' assessments of those future earnings. It is basically the ratio for valuing a company that measures its current share price relative to its per-share earnings (EPS). It helps analysts determine the relative value of a company's shares in a simplified comparison.
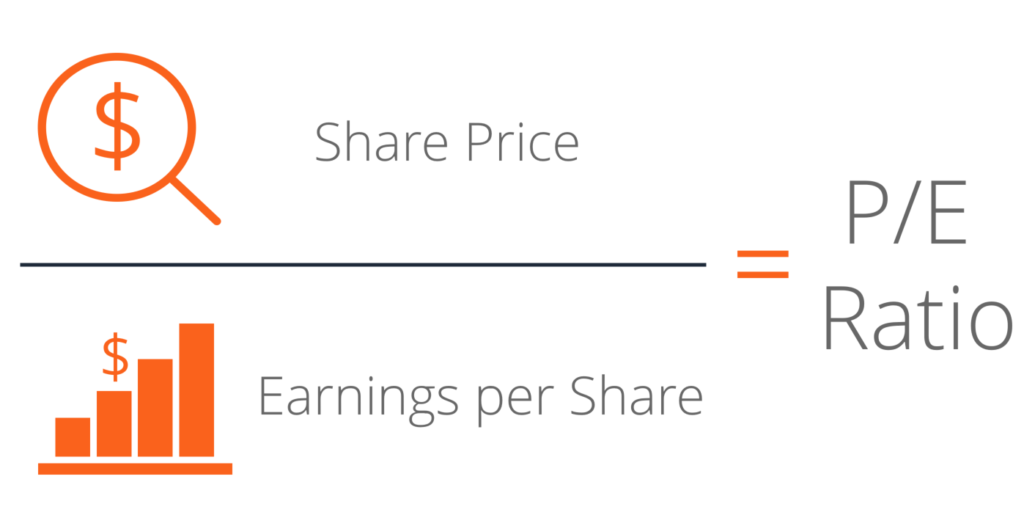
A high P/E ratio could mean two things – either that a company's stock is over-valued, or that the investors are expecting high growth rates in the future. P/E ratio of a stock tells you very little about it, unless it’s compared to the company’s historical P/E or the competitor’s P/E from the same industry.
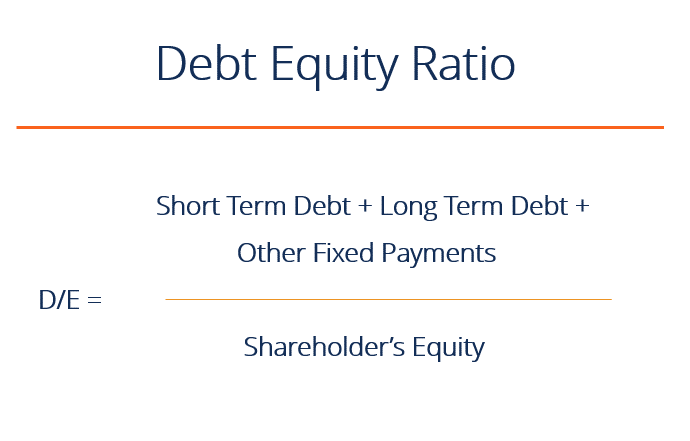
Debt-equity ratio
The debt-to-equity (D/E) is calculated by adding outstanding long and short-term debt and dividing it by the book value of shareholders' equity. When an investor approaches you to put money into your business, or buy stocks, you would obviously delve deeper into that investor’s credit worthiness. No sane business owner would want a prospective investor to be in huge debts, which would impact the overall financial stability of your business.
Higher leverage ratios tend to indicate a company or stock with higher risk to shareholders. However, the D/E ratio is difficult to compare across industry groups where ideal amounts of debt will differ.
How do financial ratios assess your business’ future?
Interesting, isn't it? Make the most of our features by giving a try right away!