What’s this about?
An extremely powerful reporting system that provides 500+ reports, and 1000+ configurations and has been used by millions for over 3 decades. We made it 10x easier to use with zero interruptions to users and no effort to learn! This post is about the engineering choices that enabled this.
Financial reports in Tally
TallyPrime has rich functionality that offers many diverse features and modules. It is extremely rich (Accounting, Inventory, Indian Taxation, International taxation), yet an amazingly simple product.
Business reports are a key component of any ERP product. Business reports provided by TallyPrime are loved by our users. These reports enable users to:
- Get key insights, slice/dice data,
- Analyze trends and take key business decisions.
Users have configurations and filters to
- Change the layout in which data is to be shown
- Control basis of calculation
- Provide business object/period/Dataset context
To be or not to be, a.k.a. To retain the configs or not!
When we have a lot of variations for each report and have 500+ reports, an interesting problem arises - which configurations should be retained when the user returns to the application the next time.
A simplistic solution is to ‘always retain’ the user’s configuration and let them change it whenever they wish to. However, from our experience in the domain and understanding user behavior for over 36 years, we know this will be an unpleasant experience. ‘%’ figures for Balance Sheet amounts are something that users will want only occasionally. Others, such as layout, are likely to be long-term preferences.
Hence, some are retained, and others are not. However, we decided to push the limits and bring an entirely new paradigm of operating the reports!
Pushing technical limits to create new experiences
Although the current setup works very well, we looked at some pain points and then analyzed different user behaviors. We wanted to push the boundary and bring a significant shift in the user experience of the product. This is both to solve existing pain points and create new usage patterns that enable users to work efficiently and with far greater control.
Call out before proceeding
As covered in some of our earlier blogs, it is worth noting that we control the entire UI Engine and Reporting stack of TallyPrime, and everything is built from scratch. We do not depend on any third-party stack for this; hence we have complete control over the areas we wish to enhance to achieve the desired outcome.
Finding patterns of usage
We considered several different things:
- As a system that may get operated by more than one user on the same computer.
- One may need to print/export a report as per the preference of a different user who is unavailable at the given moment.
- Distinct aspects impact the ‘most’ used view of a report, such as:
- Audit period requirement is different from normal operations.
- Year-end requirements are different, and so on.
4. Users deal with some ledgers, and stock items, more often than others
Challenges in finding a useful solution – scale and existing adoption in the market
- Scale: Any solution we propose needs to cater to the diversity described above — Functional module, user needs, time of product usage, and so on.
- Familiarity: Users have been using the system for a long time, and we cannot disrupt their usage patterns at all! The solution must have Tally’s class of simplicity.
Solution approach
We rejected complex solutions (complex for the user), such as allowing the user to control which configuration gets persisted etc. They would be simpler to build but hard to use. Imagine having to configure 1000 options for whether they would be retained or not! It would be akin to being a mechanic for your car when you just wanted a nice ride in it as a driver!
We narrowed down the solution to be a ‘personalized’ solution where the user can ‘Save View’ for any given report and save it under any name. This will enable the user to save virtually unlimited views – now, every user can have their own view, have different views for each purpose, and so on.
Immediately, all problems get solved– you can have a preferred view for every user, a view for Audit reasons, a view for year-end activities, and so on. What’s more? You can save a view for your most dealt-with suppliers, buyers, and stock items and access information 10x faster.
Challenges in implementing the solution approach
Along with user experience, we have the following technical and implementation-related challenges:
1. Simplicity
a. We want the experience to just work!
2. Speed
a. With so many views that can be expected to be saved, providing instant speed while saving, loading, and updating ‘views’ is crucial.
3. Scale
a. Handle the diversity of 3000+ configurations that exist.
b. Find an approach that we can implement in 500+ reports.
4. Consistency and ease of implementation
a. We will need to implement this solution across all reports of the product.
5. Maintainability
a. Solve for compatibility to ensure future enhancements continue working.
6. Functionality
a. Reports support many rich filters; they, too, need to be persisted.
b. Manage user security rights
c. Manage geography constraints on reports’ availability.. and more
Creating an amazing experience, block by block
Enter the Legos, or as we call them – Technical Building Blocks!
We have a layered architecture and hence built underlying capabilities of the system to guarantee performance, consistency, and reliability. Upper layers then use these to handle diversity and nuances of user needs and diversity.
Listed below are some of the key components of our technical solution for this problem:
1. Actions – putting abstraction into action
We introduced various new actions in TDL (Tally Definition Language) language, which would handle all complexity related to saving and applying the views. These actions are responsible for the simplicity of the end-user experience, ease of application programmer’s work, and providing robustness.
These actions are
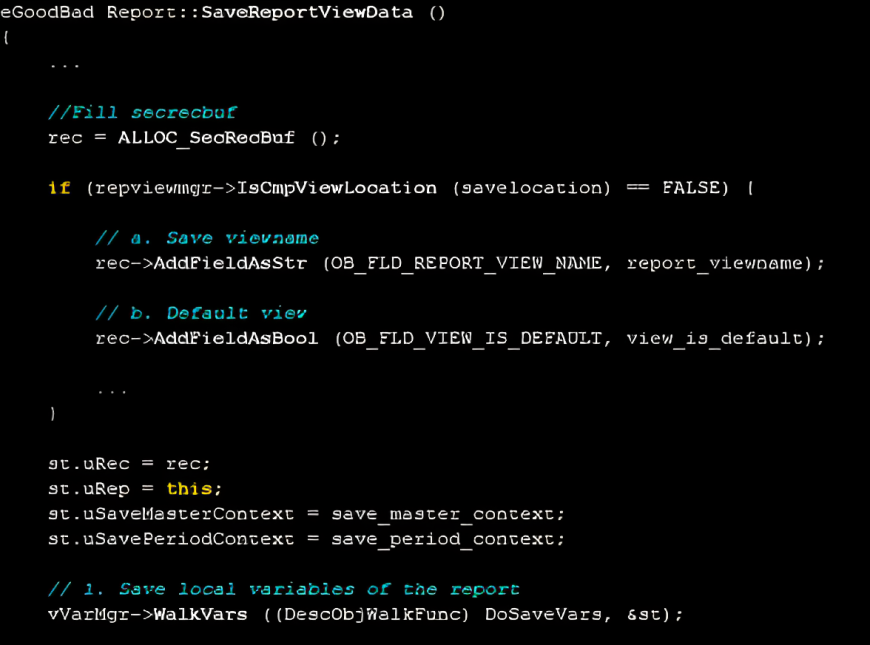
a. Save report view
- Takes care of bringing up input fields to take the name of the view, automatically detects the current report, walks all its configurations, and ‘saved’ to either preferred location as selected by the user.
- It automatically adds views to the cache to ensure the availability of views in real-time, as well as the default view for reports.
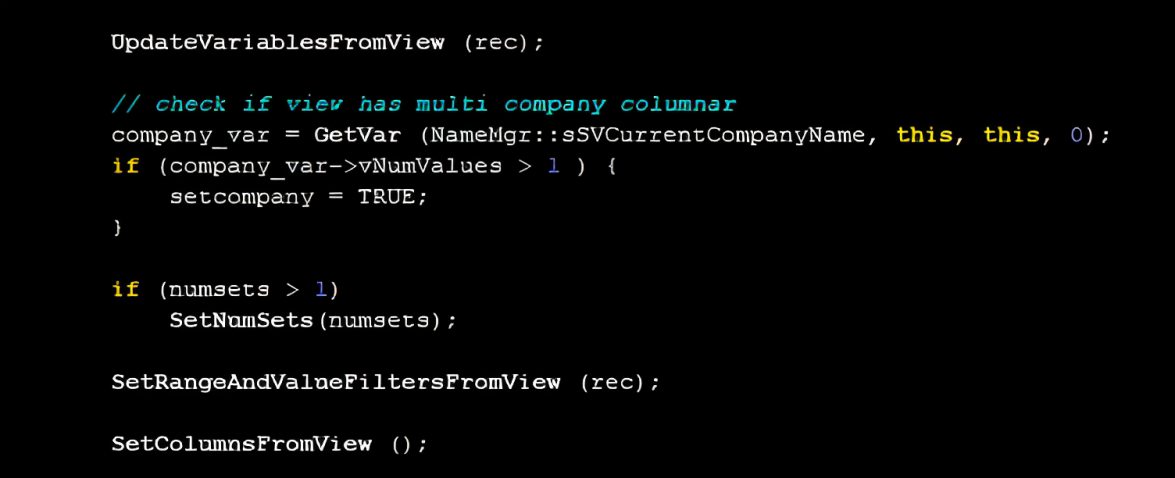
b. Load report view
- Fetches selected view file configurations from the corresponding save location and opened the report with set configurations on top of the current report.
c. Set default view
- Allows the user to change the default view for a given report.
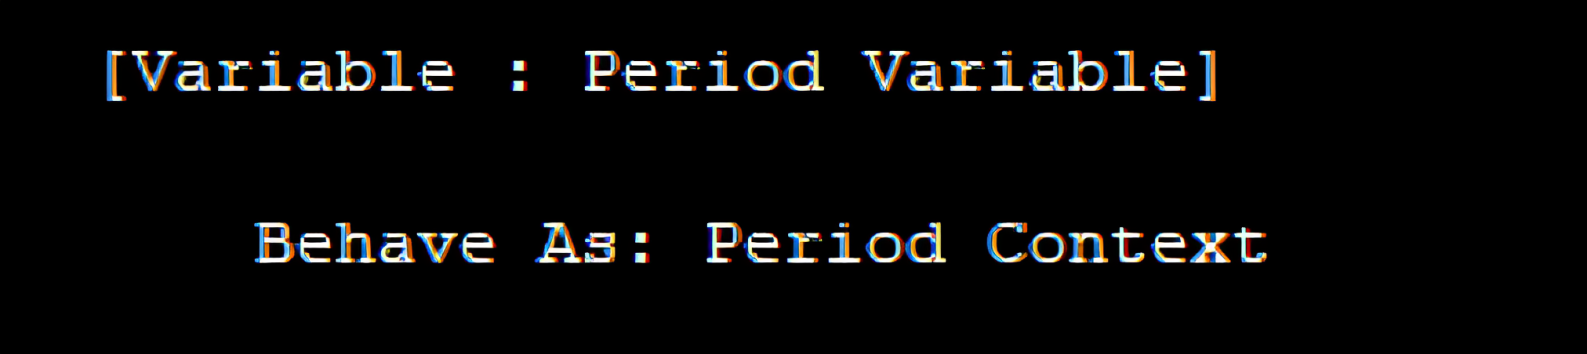
2. Variable properties – Embedding behaviors to handle diversity
- We created behaviors that accurately define what diversity exists.
- Following are the behaviors introduced and a sample code snippet of its usage:
- Business Object Context
- Period Context
- Global Context
- Skip Save
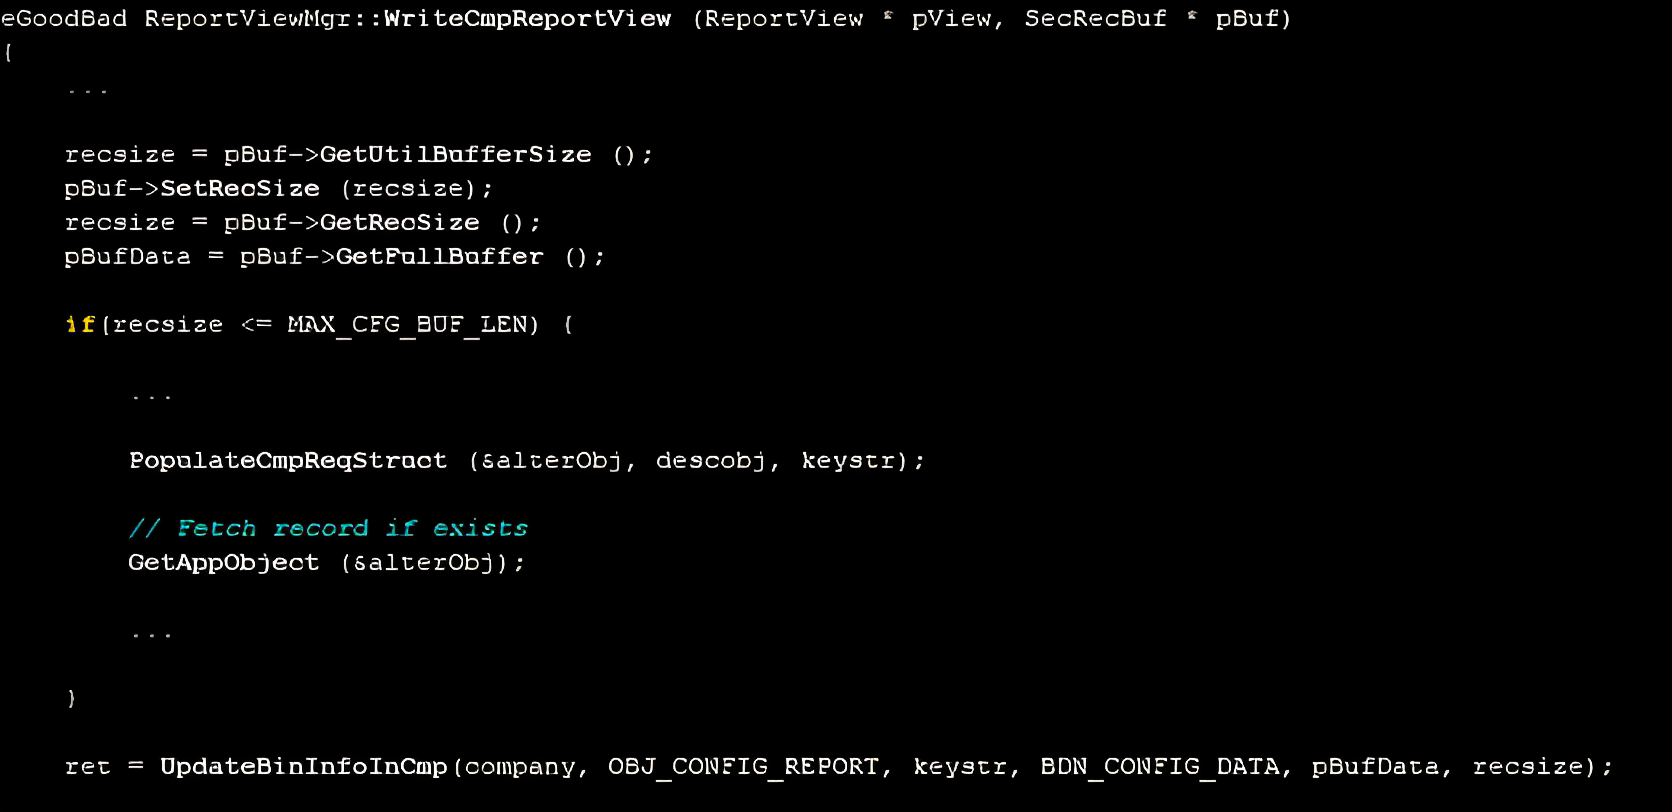
3. Binary data persistence
- We needed a mechanism to write and read a continuous piece of information, such as variable data and filters.
- Variables used in the report and their values were stored in a defined schema and filters. These values were stored as a stream of data with field IDs to write and read specific data.
- This stream of data was then stored into binary datatype by copying a specified number of bytes from the pointer to the record under the config object
4. Object enhancements
- To provide a great user experience, the user should be able to access saved views in the company/application via GoTo/SwitchTo. Information like if the saved view report is an independent report opened directly from GoTo/SwitchTo and if the saved view report is eligible to be shown in GoTo/SwitchTo w.r.t features enabled currently in the company are needed.
- We also had to determine if a saved view belonged to a report that is opened via a collection with context. This enabled us to reuse existing code in a big way.
- Objects were utilized in the following ways to achieve the above requirement:
- Standalone Report attribute is independent
- All objects having standalone reports were added to the in-memory list during application start-up. This populates saved view objects with methods from corresponding GoTo objects to access features and security rights.
- Context variable attribute was added in the object to specify the variable that served as a business object for the report.
5. Templates
- To ensure report save is available in all relevant places, we used templates – we have built and enhanced the same. The button and feature will become available at relevant places through this, without having to make changes in each report individually.
- This drives consistency and high-quality product delivery.

6. Loading views at run time (speed is everything!)
- We cache the views at app load time and manage views in-memory during the operation of the application. We only load pointers to the actual file and a few additional properties instead of the entire data.
- This enables us to provide a blazing-fast experience, all while consuming a minimal amount of additional working memory.
7. Exception handling
- To provide a delightful experience, we need to handle exceptions as well. We handle various aspects like
- User rights: Whether the user can save/alter views in the company. These rights are available to be set for any user within the company.
- Duplicate view names for the same report and saved location are rejected.
- Availability of companies required for a view - If the view to be loaded has columns repeated over multiple companies, and none of the companies are loaded or accessible for the current user, then the view would not be loaded. If the view was the default view of a report, the view would not be loaded, and the report would open as a system view.

iv. Cases like file deletion outside of the application are handled, and the user gets a clear understanding of the behavior.
Delightful experience – enabled by ground-up engineering!
The choice of binary data format allows the user to save the view at either the application level or make it part of their company data. This provides flexibility, and each user can choose what they like.
Reporting engine inherently honors the views, and the ability to set a default view for a report makes users’ life seamless by making the report open the way they like every single time.
The fact that a report such as ledger vouchers or stock item vouchers report can be saved along with their primary context means one can now create separate reports for most used entities, eliminating the need to select every time. Now, this, coupled with “GoTo,” enabled users to reach these views in a blazingly fast manner.
Visuals of final experience
Visual experience has been illustrated with a couple of screenshots from the product below:
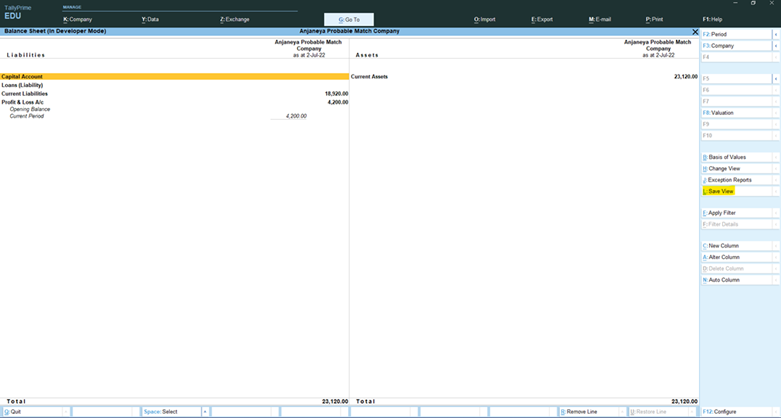
Save View button has been provided on the right button bar with “Ctrl + L” as the shortcut key.
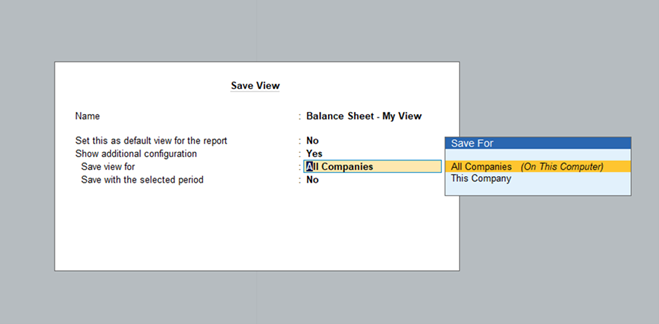
Intermediate report that opens while saving view to input details of the view.
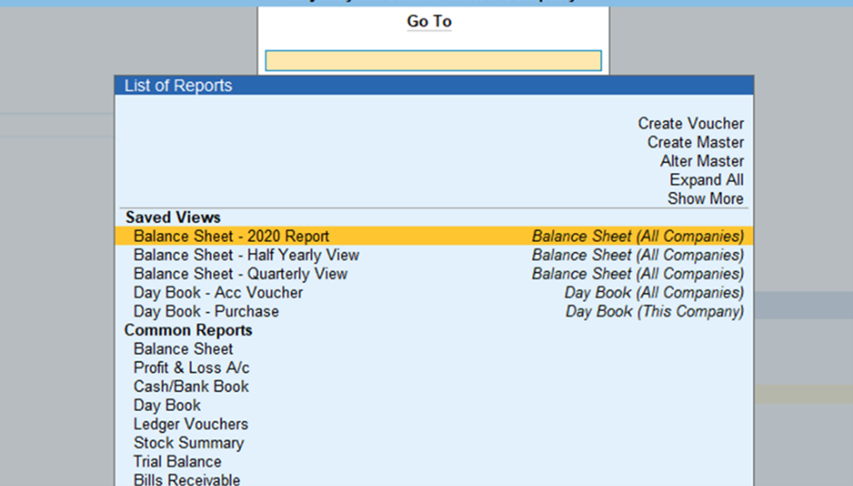
List of views saved at both application and company levels being displayed in the GoTo table.
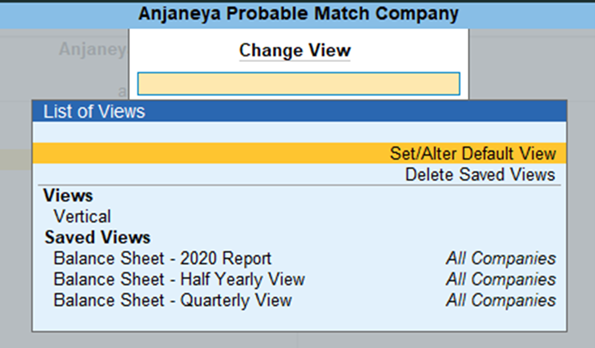
Change View also provides a list of views with options to delete and set/alter the default view of the report.
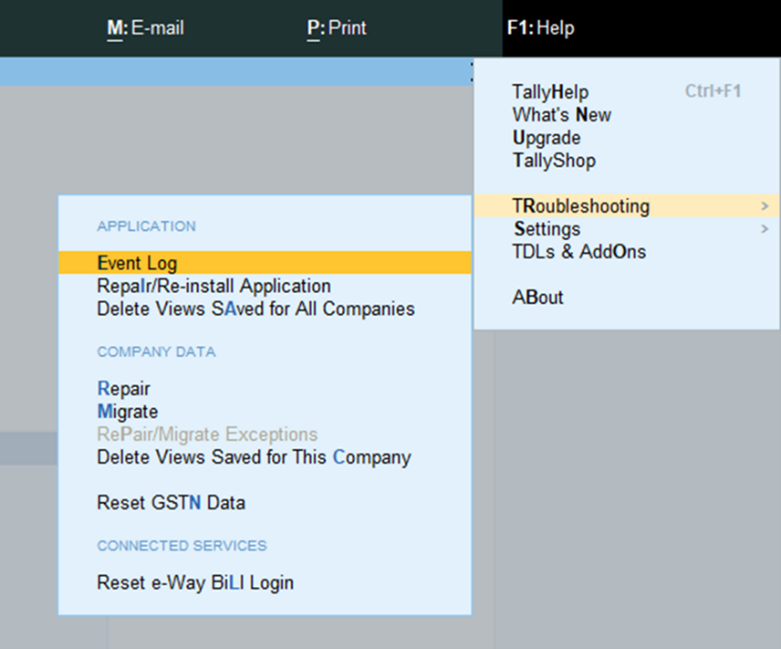
Delete views have been provided under Help Popup Menu for Troubleshooting
Read More: