Many business owners use TallyPrime to view their reports without waiting for an accountant’s summary at the end of the month. TallyPrime’s Dashboard takes everything your accountant records in the background and converts it into business-readable visuals: where your revenue is going, which customers owe you money, how your cash is positioned, and which products in your warehouse need attention.
You, the business owner, don’t require any knowledge of ledgers or debit-credit logic to understand these reports. There are simple numbers that answer the questions you ask your accountant after seeing the summary.
This blog explains what TallyPrime's dashboard displays, what decisions it supports, and why it is built for you; not just your accountant.
Accounting data vs business visibility
There is an important difference between your accounts being accurate and your business being visible to you.
When your accountant manages TallyPrime, the accounts are accurate. Every sale, purchase, and payment is recorded correctly, GST is filed on time, and your books are in order.
But accounting accuracy does not automatically translate into business visibility. While accuracy means the data is there, business visibility means you can view the data, understand it, and act on it when it matters.
Most business owners get visibility only at month-end, through a summary report or a call with their CA. By that point, the customer who stopped paying three weeks ago has already crossed 30 days overdue. The product that ran out on the 10th has been out of stock for nearly three weeks.
The data was always there on your dashboard but the visibility just came too late.
What does the TallyPrime dashboard show you
TallyPrime's dashboards are designed around the questions a business owner or manager asks every day. When you open TallyPrime's Dashboard, you see a single screen divided into tiles, each one covering a different dimension of your business.
Here is what each tile shows you, and the business question it answers.
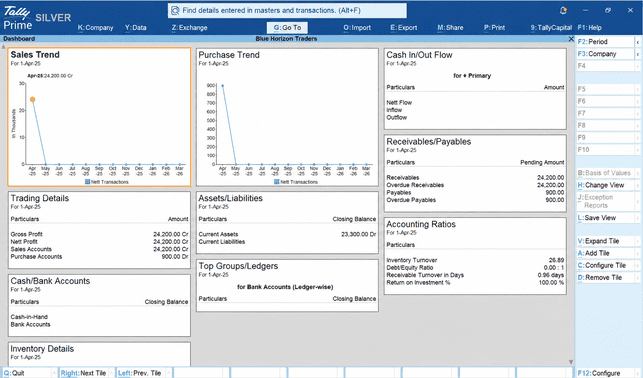
1. Sales trend
The business question it answers: Is my business growing, flat, or slipping?
The Sales Trend tile displays your sales performance as a line graph across months, from April through March. You can see at a glance how your net transactions are moving over time. A rising line means momentum. A flat or falling line means it is time to ask why.
Why it matters for decisions: When you spot a dip in May or a surge in October, you can trace it back to a specific decision like a campaign, a pricing change, a seasonal pattern. This context helps you plan.
2. Purchase trend
The business question it answers: How is my buying activity tracking against my sales?
The Purchase Trend tile mirrors the Sales Trend in format - a monthly line graph of your net purchase transactions. You can compare your buying curve against your selling curve and immediately spot if your procurement is running ahead of or behind your sales.
Why it matters for decisions: If purchases are high but sales are flat, stock is building up and capital is getting locked in. If sales are accelerating but purchases haven't kept pace, a stockout is coming. Seeing both trends side by side gives you an early signal before either problem gets expensive.
3. Cash in/out flow
The business question it answers: Is cash coming in faster than it is going out?
The Cash In/Out Flow tile shows three numbers for your primary bank and cash accounts: Net Flow, Inflow, and Outflow. This is your real-time cash pulse flow; how much came in, how much went out, and whether you are net positive or net negative.
Why it matters for decisions: Cash flow is critical for every business, particularly for MSMEs. Knowing your net flow on any given day means you can collect faster, delay a discretionary payment, or plan a credit line before you actually need it.
4. Trading details
The business question it answers: Is the business actually making money, and how much?
The Trading Details tile shows your Gross Profit, Net Profit, total Sales Accounts, and Purchase Accounts, all in one view. These are the numbers that tell you whether a busy month was also a profitable month.
Why it matters for decisions: Revenue and profit are not the same thing. A month can look busy on invoices and thin on profit if purchases, returns, or expenses run high. The Trading Details tile makes this visible before your accountant prepares the monthly P&L, while you still have time to act.
5. Receivables/payables
The business question it answers: Who owes me money, and what do I owe others?
The Receivables/Payables tile shows four numbers: Receivables (total outstanding from customers), Outstanding Receivables (what has crossed the due date), Payables (what you owe vendors), and Outstanding Payables (vendor dues that are already past due). Each figure is shown as a pending amount.
Why it matters for decisions: Outstanding Receivables is the number that most business owners should be watching daily. Every rupee sitting in that column is money that belongs to your business but has not come in yet. The tile shows you the size of the problem at a glance, so you know exactly who to call and when.
6. Assets/liabilities
The business question it answers: What does the business own, and what does it owe?
The Assets/Liabilities tile shows the closing balance of Current Assets and Current Liabilities. In straightforward terms: how much the business controls versus how much it owes at any point in time.
Why it matters for decisions: This tile is particularly useful before taking on a new loan, a large order, or a significant vendor commitment. It tells you whether the business has the financial headroom to absorb a new obligation in seconds, without calling your CA.
7. Top groups/ledgers
The business question it answers: Which accounts or groups are driving the most activity?
The Top Groups/Ledgers tile shows the closing balance of your most significant bank accounts or ledger groups. By default, it displays Bank Accounts ledger-wise, so you can see at a glance which bank account holds what balance.
Why it matters for decisions: When you are managing multiple bank accounts, this tile tells you instantly where your liquidity is sitting and which account needs attention. No need to log into net banking separately.
8. Accounting ratios
The business question it answers: How efficiently is the business running?
The Accounting Ratios tile displays four key performance ratios: Inventory Turnover, Debt/Equity Ratio, Receivable Turnover in Days, and Return on Investment (%). These ratios convert raw financial data into comparative benchmarks.
Why it matters for decisions: You do not need to be a finance expert to use these numbers. If your Receivable Turnover in Days is increasing month over month, it means customers are taking longer to pay. If your Inventory Turnover is falling, stock is moving slower than before. These ratios flag the direction of the business, not just its current state.
9. Cash/bank accounts
The business question it answers: What is the closing balance in my cash and bank accounts right now?
The Cash/Bank Accounts tile shows the closing balance of your Cash-in-Hand and all Bank Accounts, updated as of the last recorded transaction.
Why it matters for decisions: This is the simplest and most frequently checked tile. Before approving a payment, planning a purchase, or confirming a commitment, a quick glance at this tile tells you exactly what is available. It takes three seconds and saves you from cash surprises.
10. Inventory details
The business question it answers: What is the state of my stock?
The Inventory Details tile surfaces your stock position, giving you visibility into what is on hand, what is moving, and what may need attention. It connects your sales and purchase trends to what is actually sitting in your warehouse.
Why it matters for decisions: A stockout on a fast-moving item means lost sales and frustrated customers. Excess stock on a slow-moving item means capital tied up in inventory that is not contributing to the business. The Inventory Details tile gives you enough visibility to act on both before either becomes a problem.
Who is TallyPrime dashboard really for?
TallyPrime dashboard is for anyone in the business who needs to make a decision. Here is how different roles use the dashboards:
- Business Owner: Checks cash position and revenue trend weekly. Uses the outstanding receivables view to prioritise collections calls. Monitors top customers to spot any relationship that needs attention.
- Sales Manager: Uses the top customer dashboard to track account health and identify where the sales team should focus. Reviews the revenue trend to understand whether the current month is on track.
- Operations or Warehouse Manager: Checks stock health daily to plan reorders and prevent stockouts. Uses the slow-moving stock view to flag items that need to be cleared.
- General Manager / COO: Uses the overall business dashboard to get a single-screen health check of the business before the day begins.
Each of these people is making business decisions. And TallyPrime's dashboard is designed exactly for that.
Do you need to know accounting to use the dashboard
Absolutely not! This is the part that surprises most first-time users.
TallyPrime's dashboard does not ask you to interpret a trial balance or understand what a debit means. They translate what the accountant has recorded into visuals that speak in plain business language.
Revenue up this month compared to last month. Three customers have crossed 45 days outstanding. Cash is positive but tightening. Two fast-moving items are below reorder level.
The accounting happens in the background. Your accountant ensures the entries are correct, the ledgers are reconciled, and the compliance is handled. The dashboard takes that work and presents it in a format that you, as a business owner or manager, can read and act on without finance knowledge.
The 10-minute dashboard check for business owners
Here is a practical routine that many TallyPrime users already follow. It takes under 10 minutes and it keeps you informed every single day.
- Step 1 - Revenue Trend (2 minutes): Open the dashboard and look at this month's revenue compared to last month at the same point. Is it ahead, on par, or behind? That single data point sets the tone for the day.
- Step 2 - Outstanding Receivables (3 minutes): Sort by ageing. Look for any account that has crossed your follow-up threshold, typically 30 or 45 days. Make a note of one or two names to call or message today. Three minutes, and you have your collections action list for the day.
- Step 3 - Stock Health (2 minutes): Check for any fast-moving items that are below reorder level. Raise a purchase order or ask your team to. Also glance at the slow-moving list; is there anything that needs to be pushed or cleared before it becomes a write-off?
- Step 4 - Cash Flow Position (3 minutes): Check the net cash position for the week ahead. Is there anything coming in that you are counting on? Is there a large payment going out? This three-minute check can prevent a cash surprise.
And if you are not in the office, you can do this from anywhere through TallyPrime Cloud Access, on your browser or laptop.
How does the dashboard change your conversations with your CA
There is a direct benefit of using TallyPrime dashboards that most business owners do not expect. The quality of their conversations with their accountant or CA improves significantly.
When you only receive a monthly summary, conversations with your CA tend to be reactive:
- What happened last month?
- Why did expenses go up?
- What is the net profit?
When you come to the meeting already informed, the conversation shifts to strategy. You ask:
- Why did margin dip in a particular product category?
- What are the tax implications of the investment you are considering?
- Are there ways to structure the business more efficiently this quarter?
Your CA's time is most valuable when it is spent on what requires their expertise, such as, compliance, tax planning, financial structuring, audit preparation. When you stay informed through dashboards, you free them to do exactly that and you get far more from every conversation.
How to get started with TallyPrime dashboard: Quick checklist
You do not need to reconfigure anything, install add-ons, or take a course. The dashboards are already there, updated with your business data. All you need to do is:
- Log into TallyPrime and open the Dashboard from the home screen
- Spend five minutes exploring what is already visible - revenue, receivables, cash, and stock
- Identify the two or three metrics most relevant to decisions you make every week
- Set up TallyPrime Cloud Access so you can check these from your phone or laptop anytime and from anywhere
- Start with the 10-minute routine above and build from there