In today's data-driven world, businesses are generating more data than ever before. This data can be a valuable asset, but it can also be overwhelming and difficult to make sense of.
But what’s the need of establishing dashboards when you already have reports set in place?
Imagine that you are in a library, surrounded by thousands of books, each filled with a wealth of knowledge and information. These books hold the answers to countless questions, but there's a catch---all this information is scattered throughout different books at different places. The library is vast, and the information is overwhelming. And thus, you are unable to interpret the insights hidden within those pages.
A similar analogy can be seen with business data as well. There are several business reports consumed each day whilst managing business operations. While these are necessary, they become too overwhelming, especially for business owners/entrepreneurs and the key decision makers.
Think of it as trying to navigate through a crowded territory without a map. This is where dashboards come into play. Much like a map that simplifies the complexity of the surroundings, dashboards simplify complex data.
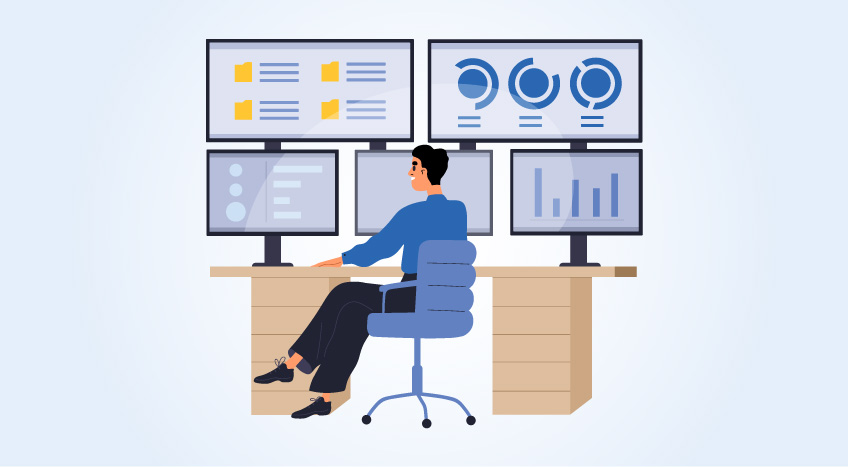
A dashboard is a visual representation of data that helps users to quickly and easily understand the key metrics and trends of their business. Dashboards can be used to track sales, marketing, operations, customer service, and many other pillars of a business.
By simplifying complex data into easy-to-understand visuals, dashboards can help businesses to identify problems, improve performance, and make better decisions.
How do dashboards simplify complex data?
Dashboards simplify complex data in a number of ways.
|
First, they aggregate data from multiple sources into a single view. This makes it easy to see how different parts of the business are performing and identify any areas that need attention. |
|
|
|
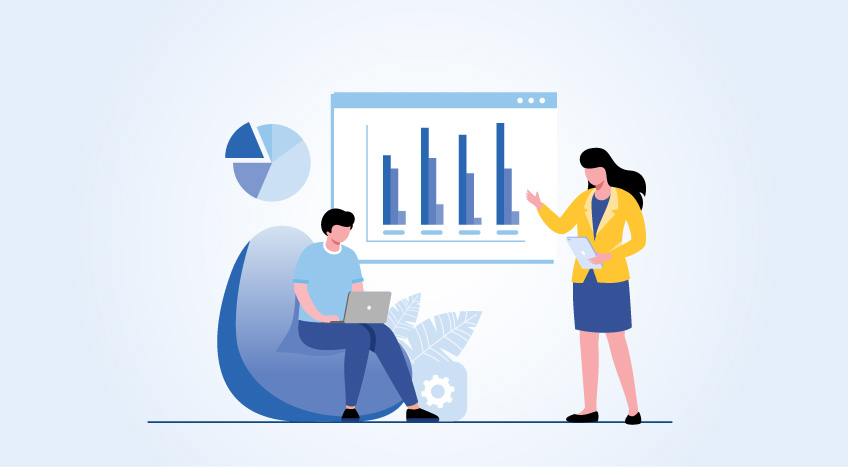
Second, dashboards use visuals to represent data. This makes it easier for the human brain to understand and process information. Charts, graphs, and other visuals can quickly convey trends, patterns, and outliers. |
|
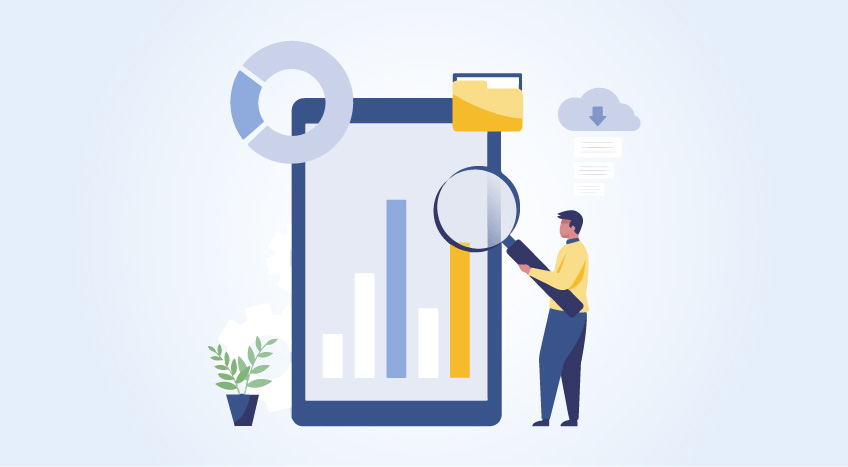
Third, dashboards are interactive. This means that users can drill down into the data to get more detailed information. This can be helpful for troubleshooting problems or identifying opportunities for improvement |
|
What are the benefits of using dashboards?
There are many benefits to using dashboards. To name a few-
|
Data Visualization Transform complex data into easily consumable visuals |
Key insights at One Place Display only the most important metrics and trends in a single view |
|
Real-Time Insights Keep the dashboards up to date to see real-time performance |
Business Performance Across Functions Bring the data from different functions at a single space to get the holistic view, and identify the scope of collaborations |
Improved decision-making:
Dashboards can help businesses to make better decisions by providing them with a clear and concise view of their data. This can help businesses to identify problems, track progress, and make informed decisions about their future direction.
Increased efficiency:
Dashboards can help businesses to improve efficiency by automating tasks and providing users with the information they need at their fingertips. This can free up time for employees to focus on other tasks, such as customer service or sales.
Improved communication:
Dashboards can help businesses to improve communication by providing a central location for data that can be easily shared with employees, partners, and customers. This can help to ensure that everyone is on the same page and working towards the same goals.
Enhanced business understanding:
Dashboards can help businesses to gain a better understanding of their business by providing them with insights into their data. This can help businesses to identify areas for improvement, develop new strategies, and make better decisions.
So how to create effective dashboards?
To create effective dashboards, it is important to keep the following things in mind:
- Start with a clear goal. What do you want to achieve with your dashboard? Once you know your goal, you can start to select the right data and metrics to track.
- Keep it simple. Too much data can be overwhelming and difficult to understand. Choose the most important metrics to track and focus on those.
- Use visuals. Visuals are a powerful way to communicate data. Use charts, graphs, and other visuals to make your data easy to understand.
- Make it interactive. Users should be able to drill down into the data to get more detailed information. This will help them to understand the data better and make better decisions.
- Update regularly. Dashboards should be updated regularly with the latest data. This will ensure that users have access to the most up-to-date information.
A few use-cases:
Here are some examples of how dashboards can be used to simplify complex data in different industries:
- A retail company can use a dashboard to track sales, inventory, and customer behavior. This information can be used to identify trends, make better pricing decisions, and improve customer service.
- A manufacturing company can use a dashboard to track production, quality, and costs. This information can be used to identify bottlenecks, improve efficiency, and reduce waste.
Conclusion
Dashboards are a powerful tool that can help businesses to simplify complex data and make better decisions. By following the tips above, you can create effective dashboards that will help your business to succeed. Dashboards can help businesses to simplify complex data and make better decisions, and can lead to improved efficiency, profitability, and customer satisfaction.
These are just a few examples of how dashboards can be used to simplify complex data and improve business performance. By using dashboards effectively, businesses can gain a better understanding of their data and make better decisions.
The new TallyPrime 4.0
The wait is over as TallyPrime is here with much more than just interactive dashboards in its latest release---TallyPrime4.0.
To meet the demands of every user and company, the all new versatile and adaptable Dashboards are equipped with numerous features.
- The insights from many reports are shown in distinct 'Tiles' on a single screen, making it simpler to follow the important financial elements of the business. It is completely adjustable and customizable to meet every business and user's needs.
- An interactive dashboard that is fully functional, allows users to drill-down for more in-depth data from any field, including the graphs.
- You can organize the dashboard in a way that best suits you by adding, rearranging, and deleting tiles.
- The ability to individually set each tile's information by including or removing the data items that are most important to you.
and so much more.....