A field guide to financial ratios for MSME owners who are tired of flying blind
Your CA gives you a P&L.
Your bank asks for a balance sheet.
Your GST portal wants returns.
But none of those documents answer the question you're actually asking at 11pm when you can't sleep:
Is my business structurally healthy or am I just busy?
The answer lives in a set of numbers called financial ratios. They're not new. They're not complicated. But they're almost never explained to MSME owners in plain language which means most businesses are running without the one dashboard that would tell them exactly where the stress is coming from.
This article is that dashboard.
Six ratios.
What each one means.
How to calculate it in under five minutes.
And most importantly what to do when the number looks wrong.
Think of it like a health checkup
A doctor doesn't diagnose you with just your weight. They check blood pressure, sugar levels, cholesterol, pulse rate. Each number tells a different part of the story. All of them together give a picture.
Your business is the same.
Revenue is your weight. Useful, but not sufficient. The ratios below are the blood work and just like blood work, the real value is in catching problems before they become crises.
Let's go through them one by one.
Ratio 1: Current Ratio - Can you pay your bills this month?
What it measures: Your ability to cover short-term liabilities with short-term assets.
Current Ratio = Current Assets ÷ Current Liabilities
Current assets include cash, debtors (receivables), inventory, and other assets you expect to convert to cash within 12 months.
Current liabilities include: creditors, short-term loans, CC/OD outstanding, GST payable, and any dues within 12 months.
What the number means:
|
Ratio |
What it signals |
|---|---|
|
Below 1.0 |
Danger zone (liabilities exceed liquid assets) |
|
1.0 – 1.5 |
Tight, manageable, but little room for error |
|
1.5 – 2.5 |
Healthy range for most MSMEs |
|
Above 3.0 |
May indicate idle cash or excess inventory |
The trap most owners fall into: A current ratio above 1.5 can still hide a cash problem if most of your current assets are stuck in slow-moving inventory or long-overdue debtors. The ratio looks fine. The bank account doesn't.
Which is why you need the next one.
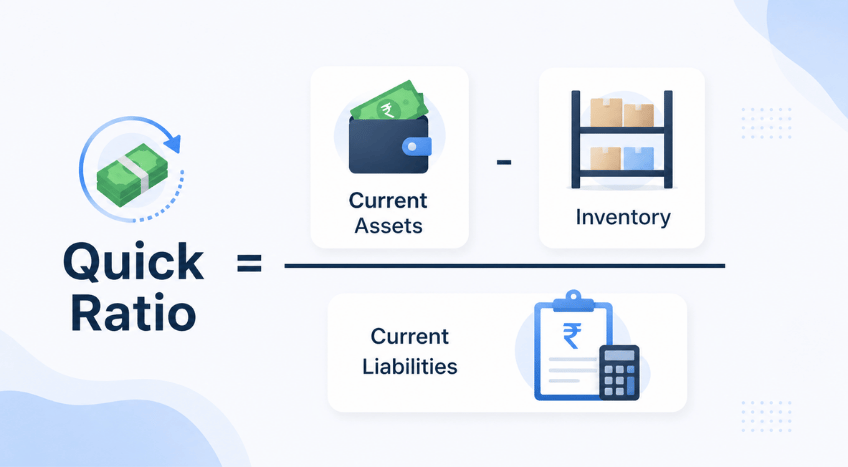
Ratio 2: Quick Ratio - What if inventory didn't exist?
What it measures: Your ability to meet short-term obligations without relying on selling inventory.
Quick Ratio = (Current Assets − Inventory) ÷ Current Liabilities
Also called the Acid-Test Ratio because it strips away the asset that can't be converted to cash quickly.
What the number means:
|
Ratio |
What it signals |
|---|---|
|
Below 0.8 |
Serious liquidity risk (dependent on inventory liquidation) |
|
0.8 – 1.2 |
Acceptable range for manufacturing MSMEs |
|
Above 1.2 |
Strong short-term position |
Why this matters more than the Current Ratio for most MSMEs:
A garment trader with ₹18 lakh in inventory, ₹4 lakh in receivables, and ₹16 lakh in creditor dues has a Current Ratio of 1.37 which looks acceptable. But the Quick Ratio is 0.25, which means if his buyers stop paying or his inventory doesn't move, he cannot cover even a quarter of his dues.
This is the ratio that reveals a business that looks solvent but runs on a knife's edge.
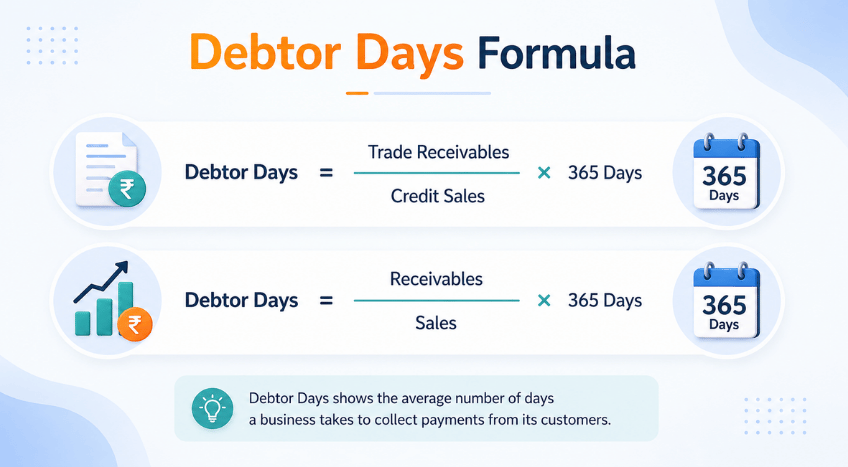
Ratio 3: Debtor Turnover & Debtor Days - How long is your money sitting outside?
What it measures: How efficiently you're converting your credit sales into actual cash.
Debtor Days = (Total Debtors ÷ Annual Credit Sales) × 365
If your debtors at any point are ₹15 lakh and your annual credit sales are ₹90 lakh:
Debtor Days = (15 ÷ 90) × 365 = **61 days**
That means your average customer is taking 61 days to pay you.
What the number means:
|
Debtor Days |
What it signals |
|---|---|
|
Under 30 |
Excellent (tight credit control) |
|
30 – 45 |
Healthy for most industries |
|
45 – 60 |
Manageable, but watch for concentration risk |
|
Above 60 |
Cash flow strain is likely (start investigating) |
The concentration trap: This average can mask serious risk. If 70% of your sales go to 2 customers and both are slow payers your effective Debtor Days for the revenue that matters is much higher than the number suggests. Always calculate this separately for your top 3 customers.
The direct cost: Every extra 15 days in Debtor Days typically freezes ₹1.2 to ₹2 lakh in working capital for every ₹3 crore of annual sales. That frozen capital has a price either in CC interest or in growth you couldn't fund.
Ratio 4: Inventory Turnover & Inventory Days - How much cash is sitting in your warehouse?
What it measures: How many times your inventory is sold and replaced in a year and how many days it sits before that happens.
Inventory Days = (Average Inventory ÷ Cost of Goods Sold) × 365
If your average inventory is ₹20 lakh and your annual COGS is ₹1.2 crore:
Inventory Days = (20 ÷ 120) × 365 = 61 days
Your stock is sitting for 61 days on average before it's sold.
Benchmarks by business type:
|
Type of Business |
Healthy Inventory Days |
|---|---|
|
FMCG / Fast-moving goods |
Under 30 days |
|
General trading / distribution |
30 – 45 days |
|
Manufacturing (job-to-order) |
20 – 40 days |
|
Manufacturing (finished goods) |
35 – 55 days |
|
Seasonal / project-based |
Must be planned cycle by cycle |
The question this ratio forces: Every item sitting beyond its benchmark is costing you in CC interest, in storage, in the risk of price erosion or obsolescence. The ratio doesn't ask you to liquidate everything. It asks you to know which items are contributing to the number and why.
A monthly SKU-level review against this ratio is one of the highest-ROI habits an MSME owner can build. It usually takes 90 minutes. The cash it frees up routinely pays for that time ten times over.
Ratio 5: DSCR - The number your bank is quietly calculating about you
What it measures: Whether your business generates enough cash to service its debt (loans, EMIs, interest).
DSCR = Net Operating Income ÷ Total Debt Service
Where:
- Net Operating Income = EBITDA (earnings before interest, tax, depreciation, and amortisation)
- Total Debt Service = principal repayments + interest payments in that period
If your annual EBITDA is ₹18 lakh and your total loan repayments (principal + interest) for the year are ₹12 lakh:
DSCR = 18 ÷ 12 = 1.5
What the number means:
|
DSCR |
What it signals |
|---|---|
|
Below 1.0 |
Business cannot service its debt from operations (critical) |
|
1.0 – 1.25 |
Technically solvent, but zero buffer (banks are nervous) |
|
1.25 – 1.5 |
Minimum acceptable for most bank lending |
|
Above 1.5 |
Comfortable — ability to take on additional credit if needed |
Why this is the ratio most MSME owners have never calculated but every banker has:
When you walk into a bank for a term loan or CC enhancement, your relationship manager opens a spreadsheet and calculates your DSCR within the first five minutes. If it's below 1.25, most sanction committees won't approve regardless of how well the conversation went.
Knowing your DSCR before the bank does — and knowing which levers to improve it — is the difference between an owner who gets credit when they need it and one who gets rejected for reasons they don't fully understand.
Ratio 6: Operating Cash Flow Ratio - Does your core business actually generate cash?
What it measures: Whether your day-to-day operations are producing real cash or just accounting profit.
Operating Cash Flow Ratio = Cash Flow from Operations ÷ Current Liabilities
This ratio requires a cash flow statement, not just a P&L. If your business is on TallyPrime or any ERP, this number can be pulled. If not, your CA can calculate it.
What the number means:
|
Ratio |
What it signals |
|---|---|
|
Below 0.5 |
Operations are not generating sufficient cash (probe immediately) |
|
0.5 – 1.0 |
Borderline (business needs to improve cash conversion) |
|
Above 1.0 |
Core business is cash-generative (healthy signal) |
Why this is the most honest ratio of all:
P&L profit can be inflated by aggressive revenue recognition, slow depreciation, or timing. Cash flow from operations cannot be manufactured the same way. It reflects what actually moved in and out of your business.
A business with ₹40 lakh in net profit but an Operating Cash Flow Ratio of 0.4 is telling you something important: the profit is real on paper, but the cash isn't landing. The culprit is almost always sitting in Debtor Days or Inventory Days which is why all six ratios are meant to be read together.
Reading your ratios as a system
None of these ratios tells the full story in isolation. They're designed to be cross-referenced.
Here's a quick diagnostic framework:
If Current Ratio is low + Debtor Days is high:
Your cash problem is in collections. Tighten credit terms, introduce early payment incentives, prioritise follow-up on ageing receivables.
If Current Ratio looks fine + Quick Ratio is low:
Your liquidity is dependent on inventory conversion. Check Inventory Days, if it's high, you have a stock management problem. If turnover is actually fast, you're fine.
If DSCR is below 1.25 + Operating Cash Flow Ratio is below 0.5:
Your debt load has outpaced your operational efficiency. Before adding any new credit, this is the combination that needs urgent attention.
If all ratios are healthy + bank account still feels tight:
Run the Working Capital Cycle: Debtor Days + Inventory Days − Creditor Days. If above 55 days, the structural timing gap between cash outflow and inflow is the issue even if each ratio looks acceptable in isolation.
How to start today not next quarter
You don't need a finance team. You need two documents: your latest balance sheet and a basic P&L. From those, all six ratios can be calculated in under 30 minutes.
Do it once. Note where each ratio falls against the benchmarks above. The ones that are off, those are your one or two highest-priority fixes.
Then recalculate every quarter. Not to check a compliance box. But because a business that knows where its stress is coming from is a business that can actually do something about it.
The owners I've worked with who build this habit, even informally, even on a sheet of paper, consistently make better decisions about credit, inventory, and customer terms. Not because they've become finance experts. But because they've stopped flying blind.