It’s no secret that decision-making is the secret sauce of running a successful business. Making the right decisions at the right time is what keeps your business snowballing. These decisions could be related to expanding your operations or cutting down costs divisions.
But how do you make informed decisions for your businesses every time? The answer in your business reports that your sophisticated analytics and reporting tools have pulled up for you. A look at them will give you an idea about the health of your business at any given point in time, helping you make better decisions and almost accurate forecasts. But more than that, it will help optimize your business inventory management, which is one of the pillars of a successful business.
In this blog, we will shed light on nine ways business reports can help improve your inventory management. Let’s dive in:
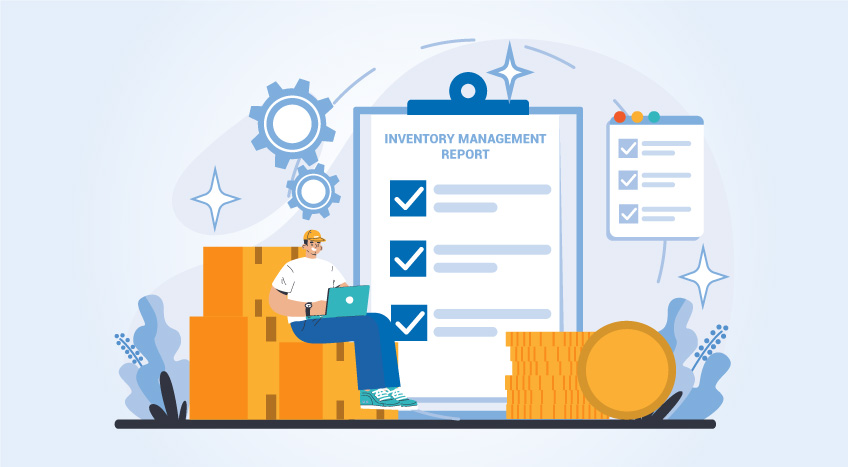
Inventory-specific business reports and how they help you
Inventory-specific business reports are reports that provide you with a detailed view of your inventory. Regardless of the tools and technologies you use, you can optimize your inventory management, manage customer demands better, make more accurate forecasts and increase your profitability with the help of these inventory-specific reports.
-
Inventory performance
Yes, you guessed it right! This report gives you the detailed performance of all your inventory items, helping you make a qualified decision. It helps you find stocks that have outperformed or underperformed, measure the overall performance of your warehouse and more. This way, you can cut down the inventory costs considerably and focus only on the top-moving stock by eliminating the poor performers, especially when there is nothing more you can do about it.
-
Inventory profitability
Performance leads to profitability. The inventory profitability report helps you understand how each of your stock-keeping units (SKU) has performed, the net margins earned, and the impact of the SKU’s performance on your overall brand reputation and profitability. By calculating the profit generated in all individual sales channels, you can optimize your inventory management more quickly.
-
Sales data
This report helps you know if your business is in gain or loss. It helps you look into your accounting operations, from your cash flows, sales summary of each stock item in every sales channel to details of discounts, taxes, and refunds of individual items to more.
For businesses, this means picking up the sales patterns for stock items for a given period, customer preferences, and seasonal trends and making better and more accurate forecasts. When your forecasts improve, the chances of stock-out or excessive stock get reduced considerably.
-
Stock levels
When do the stock items in your SKUs reach their critical level? When and how often should you replenish them to fulfill all customer orders without any delays? Is there a risk of facing a stock-out issue for a particular item?
The stock-levels report gives you the answers to these queries. Using inventory management software like TallyPrime and this report as the base, you can set auto-replenishment levels for your stock. This way, you can arrange for fresh stock well before your existing stock reaches its critical thresholds.
-
Inventory forecasts
In addition to the sales data and stock levels report, you can use the inventory forecasting report to make accurate forecasts that align with customer demands. This report gives you a detailed analysis of historical sales data and merges your proposed promotional strategies with it. It can help forecast your stock needs to meet increasing customer orders, high seasonal demands and more.
-
Cost of goods sold
How good is the financial health of your business? Is the price of your products in line with the market standards? How do you account for your taxes and still make a reasonable profit margin? Does any division need more or less investment than others? Do you need to entirely revamp or cut down operations in any division?
The cost of goods sold (COGS) report gives you the answers to these important questions. In short, it lets you know if your inventory is adding to your profitability or not. The senior management makes critical business decisions based on the numbers that it includes.
-
Purchase order
The purchase order report gives you the status of stock items that enter and leave the SKUs. It has details of all your customer orders so that you know how many have been fulfilled and how many are pending fulfilment. You can also learn the latest trends in the products through this report, helping you plan better for future demands.
-
Customer analytics
This report helps you understand the pulse of your customers and helps you give them a special experience. You can understand customers’ purchase behaviors, most preferred products, number of repeat customers, number of recent customers, and other related information through this report. This will help you think of strategies to improve and enrich your loyal customers by giving them high-quality service at all times.
-
Shipment trends
The shipment trends report helps you understand the causes of order fulfillment delays and rectify them timely. It gives you the shipping trends and the performance of your warehouse for every single sales channel.
[Related Read: 4 Inventory Management KPIs to Track for Business Efficiency]
Bottom line
Inventory-based business reports help you make smart decisions to improve your profitability and reputation. Using proper business management software, such as TallyPrime, to pull out these reports can help you detect potential problems at an early stage and nip them in the bud before they grow into bigger troubles. Managing your inventory will become a smarter, leaner, and more accurate process once you leverage these reports.