To access the reports available in Tally.CRM follow the steps shown:
In the Tally.CRM screen
Click Reports tab
The Support Dashboard screen appears as shown:
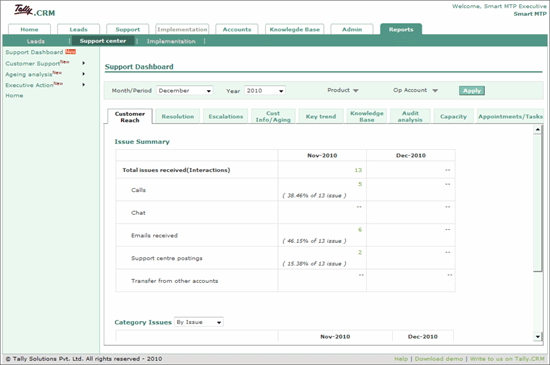
In the CRM Dashboard select any one or all the parameters displayed to filter information based on your requirement.
By default this field is set to the current month, select the required Month/Period from the drop down list.
By default this field is set to the current year, select the required Year from the drop down list.
Select the required Product from the list provided, a tick appears against the product selected.
Select the required Operating Account from the list provided, a tick appears against the operating account selected.
Click Apply
The filters are applied to the currently selected tab and all the tabs appearing in this report.
Click the required tab to view the respective information.
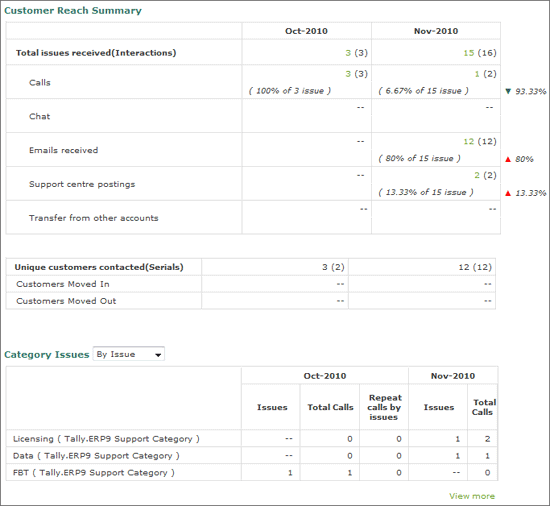
By default, the report Customer Reach tab is active in CRM Dashboard. This tab displays the customer reach for the last month and the previous month using
Different media for communication
Issues posted from the support centre
Issues transferred from other accounts
Calls made to or landed from unique serial numbers
Filter issues by unique serial number
The Customer Reach tab in CRM Dashboard appears as shown:
Click View more
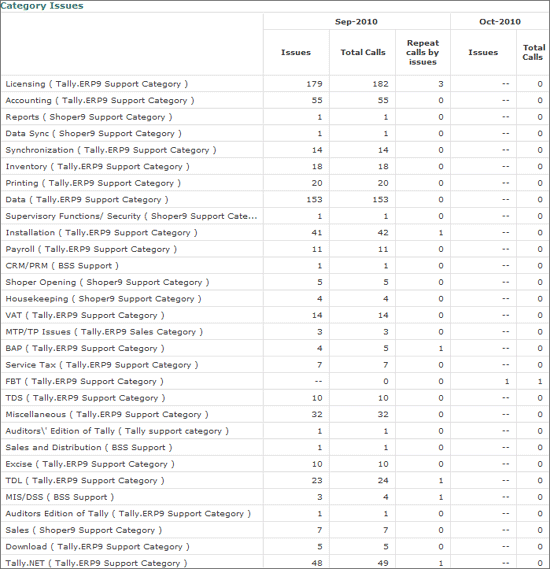
The Category Issues report displaying the issues for each category appears as shown
Displays the issues resolved during the last month and the previous month. This report allows you to drill down to the lowest level of viewing an issue from the report. The ageing can be set in Business Hours also.
To view the resolutions report, follow the steps shown:
Click Resolutions
The Resolutions screen appears as shown
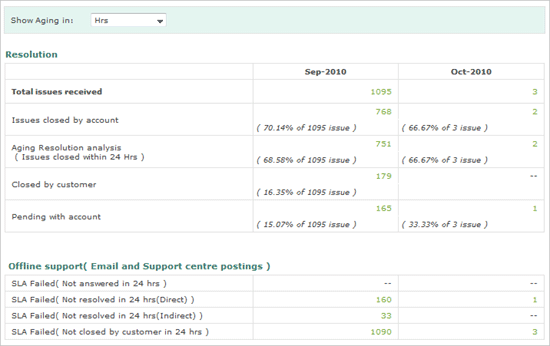
To age the based on the business hours
Select Business Hrs for Show Aging in
The duration of business hours and the days to be excluded appear
Click Configure
In the configuration screen you can
Set the Business Hours
Set the days that need to be excluded for ageing
Click Submit
The Resolution Ageing analysis report appears as shown:
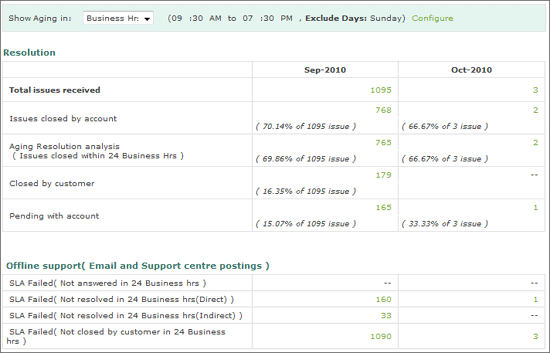
To view the resolution category for the respective month
Click the number shown in green
The Ticket Listing appears as shown

You can perform the following operation in the ticket listing screen
Export a report
Transfer the ticket to another agent
Navigate to the Previous or the Next page
Click required Ticket number to view all details about the issue.
Displays the number of issues escalated or transferred to the next level due to various reason. Each category displays the number of issues transferred or escalated.
To display the number of issues escalated follow the steps shown:
Click Escalations
The screen displaying the issues escalated appear as shown
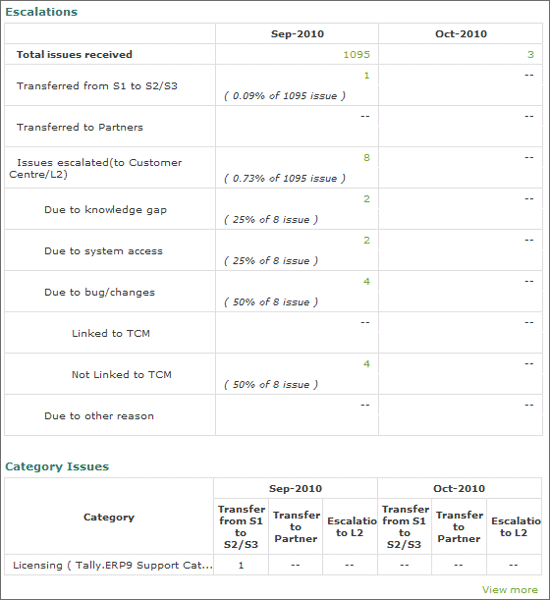
Click View More
The Category Wise Escalation Summary appears as shown

To view the escalation category for the respective month
Click the number shown in green
Displays the aging analysis of unique and category wise calls received from the customer and partner for the current and previous month.
To view the ageing analysis of calls, follow the steps shown
• Click Aging tab
The Unique Customer Aging report appears as shown
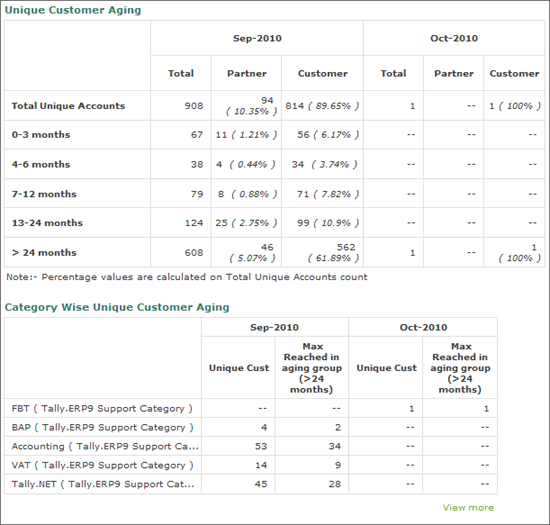
Click View More
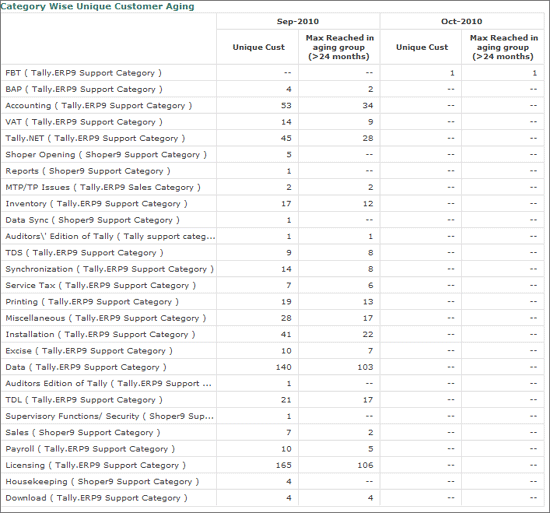
The Category Wise Unique Customer Aging report appears as shown
This report exclusively displays the usage of Knowledge Base by different user across the Eco-system, it also displays statistics on the resolutions using articles published apart from top viewed and least view articles. It also keeps track of the request for articles by customer and partners.
To view the statistics for the usage of knowledge base, follow the steps shown
In the CRM Dashboard
• Click Knowledge Base tab
The Knowledge Base details appear as shown
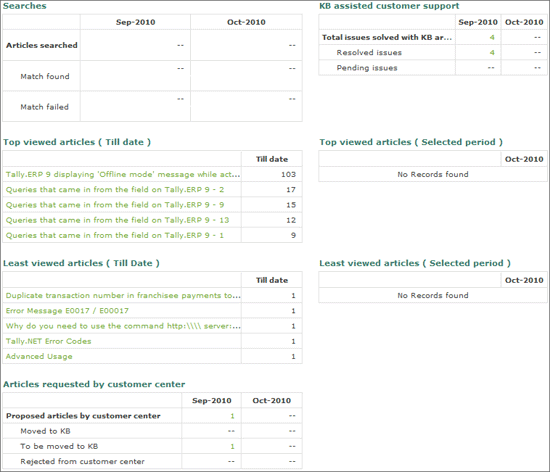
Searches displays information on total articles searched, matches found and failed for the current and the previous month. To view details click on the numbers displayed in green for each month.
KB Assisted Customer Support displays the issues resolved using articles published on the Knowledge Base.
Top Viewed Articles till date displays the top viewed articles as on the date of report.
Least Viewed Articles till date displays the least viewed articles as on the date of report.
Articles requested by customer centre displays the number of articles requested by the customer centre, request that were accommodated and rejected. You can click on the required column to view more information.
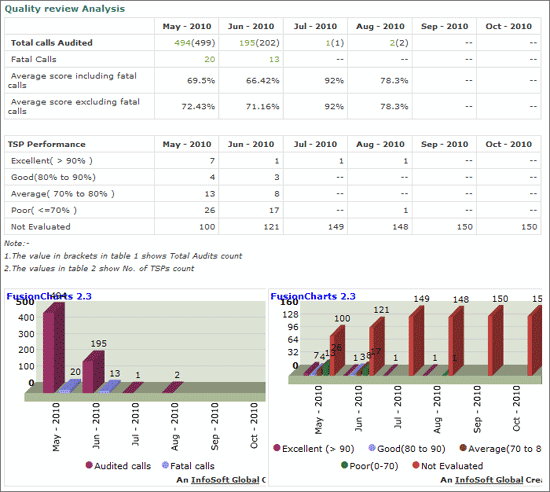
Displays the quality review analysis of calls for the last six month, these statistics are supplemented with charts which help you in analyzing.
To view the quality analysis of calls follow the steps shown
In the CRM Dashboard
Click Audit Analysis
The Quality Review Analysis appears as shown
Display’s the support resources available including Support Managers and Executives with your organization as on the date of the report.
To displays the support resources available follow the steps shown
In the CRM Dashboard screen
• Click Capacity tab
The Capacity screen appears as shown:

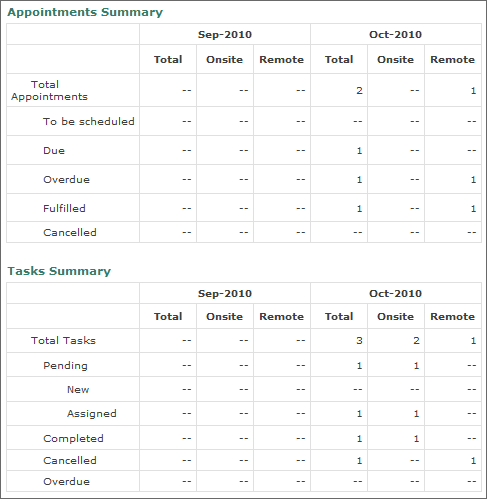
Display’s the Appointment and Tasks summary for the current and the previous month.
To view the Appointment and Tasks summary follow the steps shown
In the CRM Dashboard
• Click Appointments/Tasks
The Appointment and Tasks summary appears as shown
